- Delta Air Lines (NYSE: DAL) cut its 2026 adjusted EPS guidance on October 9 from $6.50 to $7.50 down to $5.10 to $5.60, a -23.6% move at the midpoint. Three months earlier it had reaffirmed the same $6.50 to $7.50 range. Third-quarter adjusted EPS came in at $1.72, below the $2.00 to $2.50 the company had guided in July, even though adjusted operating revenue rose +16% to $17.585 billion on seat capacity that was flat with a year earlier.
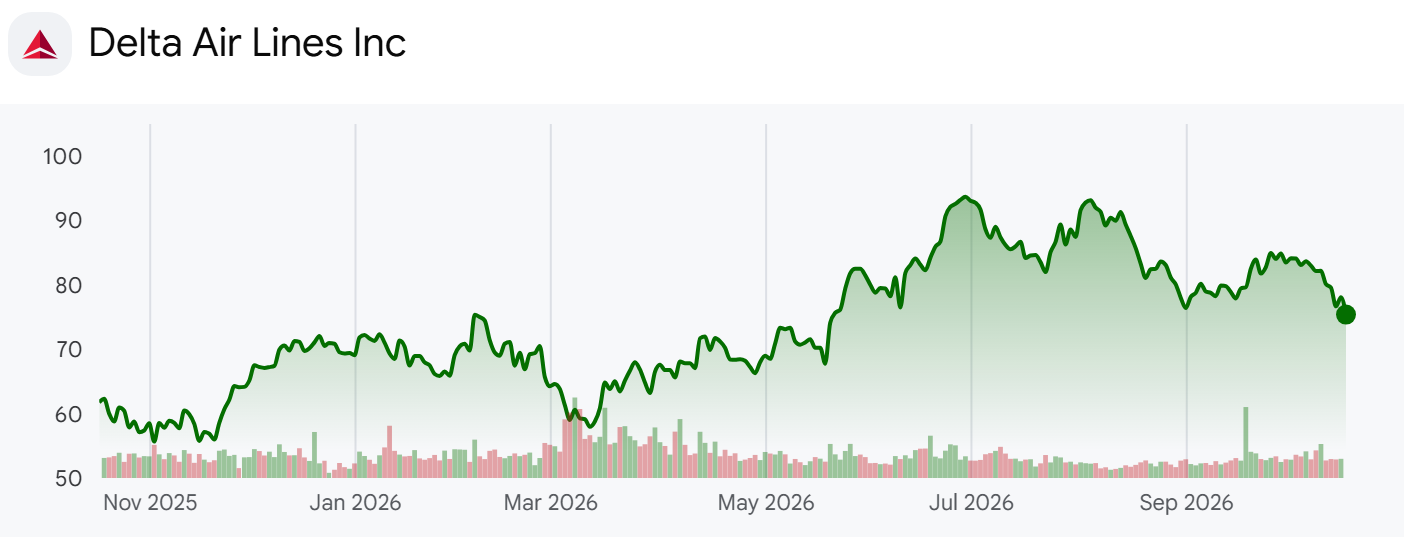
- Among the four large US carriers, Delta has the highest trailing twelve-month revenue. The stock trades at $75.37 for a market value of $49.32 billion. On a dividend-adjusted weekly basis it peaked at $92.27 in the first week of July and now sits -18.3% below that level, yet it is still +32.8% higher than a year ago.
- This piece follows the eight full-year EPS guidance statements Delta made across eight quarterly releases over the past year and a half, lining up each annual range, each quarterly range, the fuel price assumed at the time, and the result. Delta has not yet guided for 2027, and fourth-quarter figures here are company guidance only. EPS, revenue, and fuel price are Delta's adjusted (non-GAAP) figures unless marked as GAAP.
What Delta's Third-Quarter Release Says About the Cut
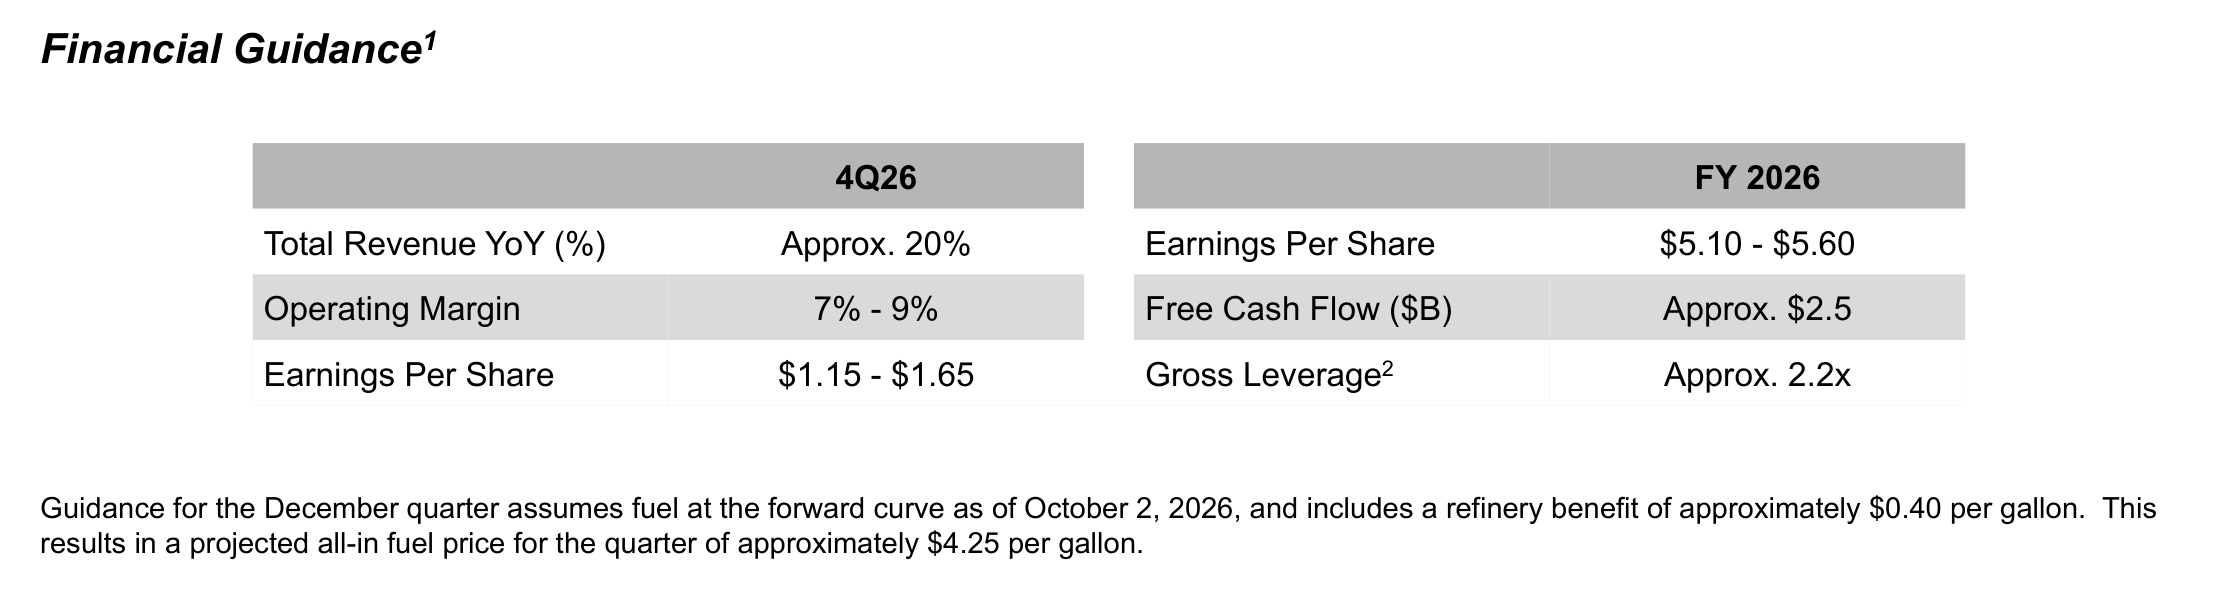
- The headline of the third-quarter earnings release claims "structural durability in high fuel cost environment." Its guidance table, on page 2, lists fourth-quarter revenue growth of about 20%, an operating margin of 7% to 9%, and EPS of $1.15 to $1.65, alongside full-year EPS of $5.10 to $5.60, free cash flow of about $2.5 billion, and gross leverage of about 2.2 times.
- Company disclosure (third-quarter release and earnings call): Third-quarter pretax income of $1.5 billion was flat with last year. Fuel expense rose $1.6 billion, more than $500 million of it above what the July guidance assumed. Full-year pretax income of about $4.5 billion is fairly close to last year even though fuel costs rise about 60%, or about $6 billion.
- On the same call, management said resilient demand and a sharper focus on profitability are letting the industry recover higher fuel costs more quickly. Many carriers, it added, were failing to earn their cost of capital well before the run-up. On its own revenue, the line was "Even when fuel prices eventually moderate, and they will," followed by the claim that the underlying strength is sustainable.
- The July call reads differently. On July 10, Delta said it was holding its January guidance despite billions of dollars of fuel headwind, described $6.50 to $7.50 as 20% growth over the prior year, and kept free cash flow guidance of $3 billion to $4 billion. The fuel price assumed in that third-quarter guidance was $3.15 a gallon. The actual adjusted price was $3.61.
- When an analyst asked about 2027 margins in October, the chief executive declined to give a walk. The biggest variable, he said, is where fuel volatility settles, and while he expects prices to recede he does not know at what level or pace. He listed levers Delta controls regardless of fuel, such as larger aircraft, new fleet efficiencies, and crew operations, and said the company needs a little assistance from fuel to accelerate the path to its mid-teens margin target.
- The January release put 2025 adjusted results at EPS of $5.82, pretax income of $5.0 billion, free cash flow of $4.6 billion, and gross leverage of 2.4 times. Own calculation (new guidance against 2025): The $5.10 to $5.60 range is -12.4% to -3.8% below 2025's $5.82. Pretax income of about $4.5 billion is 10.0% lower, and free cash flow of about $2.5 billion is 45.7% lower.
- Putting the July guidance row for the third quarter next to the result shows where the miss came from. Revenue guided up mid-teens grew 16%, the operating margin guided at 11% to 13% landed at 9.4%, and EPS guided at $2.00 to $2.50 came in at $1.72. Revenue arrived as planned and the profit leaked out through costs. Third-quarter free cash flow was $460 million, and debt and finance lease obligations fell 13.6% from a year earlier to $12.851 billion.
The Three-to-Five-Year Targets in Delta's March Presentation
- Delta presented a 16-page deck at the J.P. Morgan Industrials Conference on March 17. Page 4 pairs a line about raising revenue guidance on demand momentum with a line saying the industry was quickly recapturing higher fuel costs. The same page says corporate and consumer demand accelerated in March, with domestic and international unit revenue both up mid-single digits. It also says Delta would keep the flexibility to cut capacity if elevated fuel persisted, and warned that first-quarter non-fuel unit costs would rise mid-single digits. The third quarter's 7.3% was above that range.
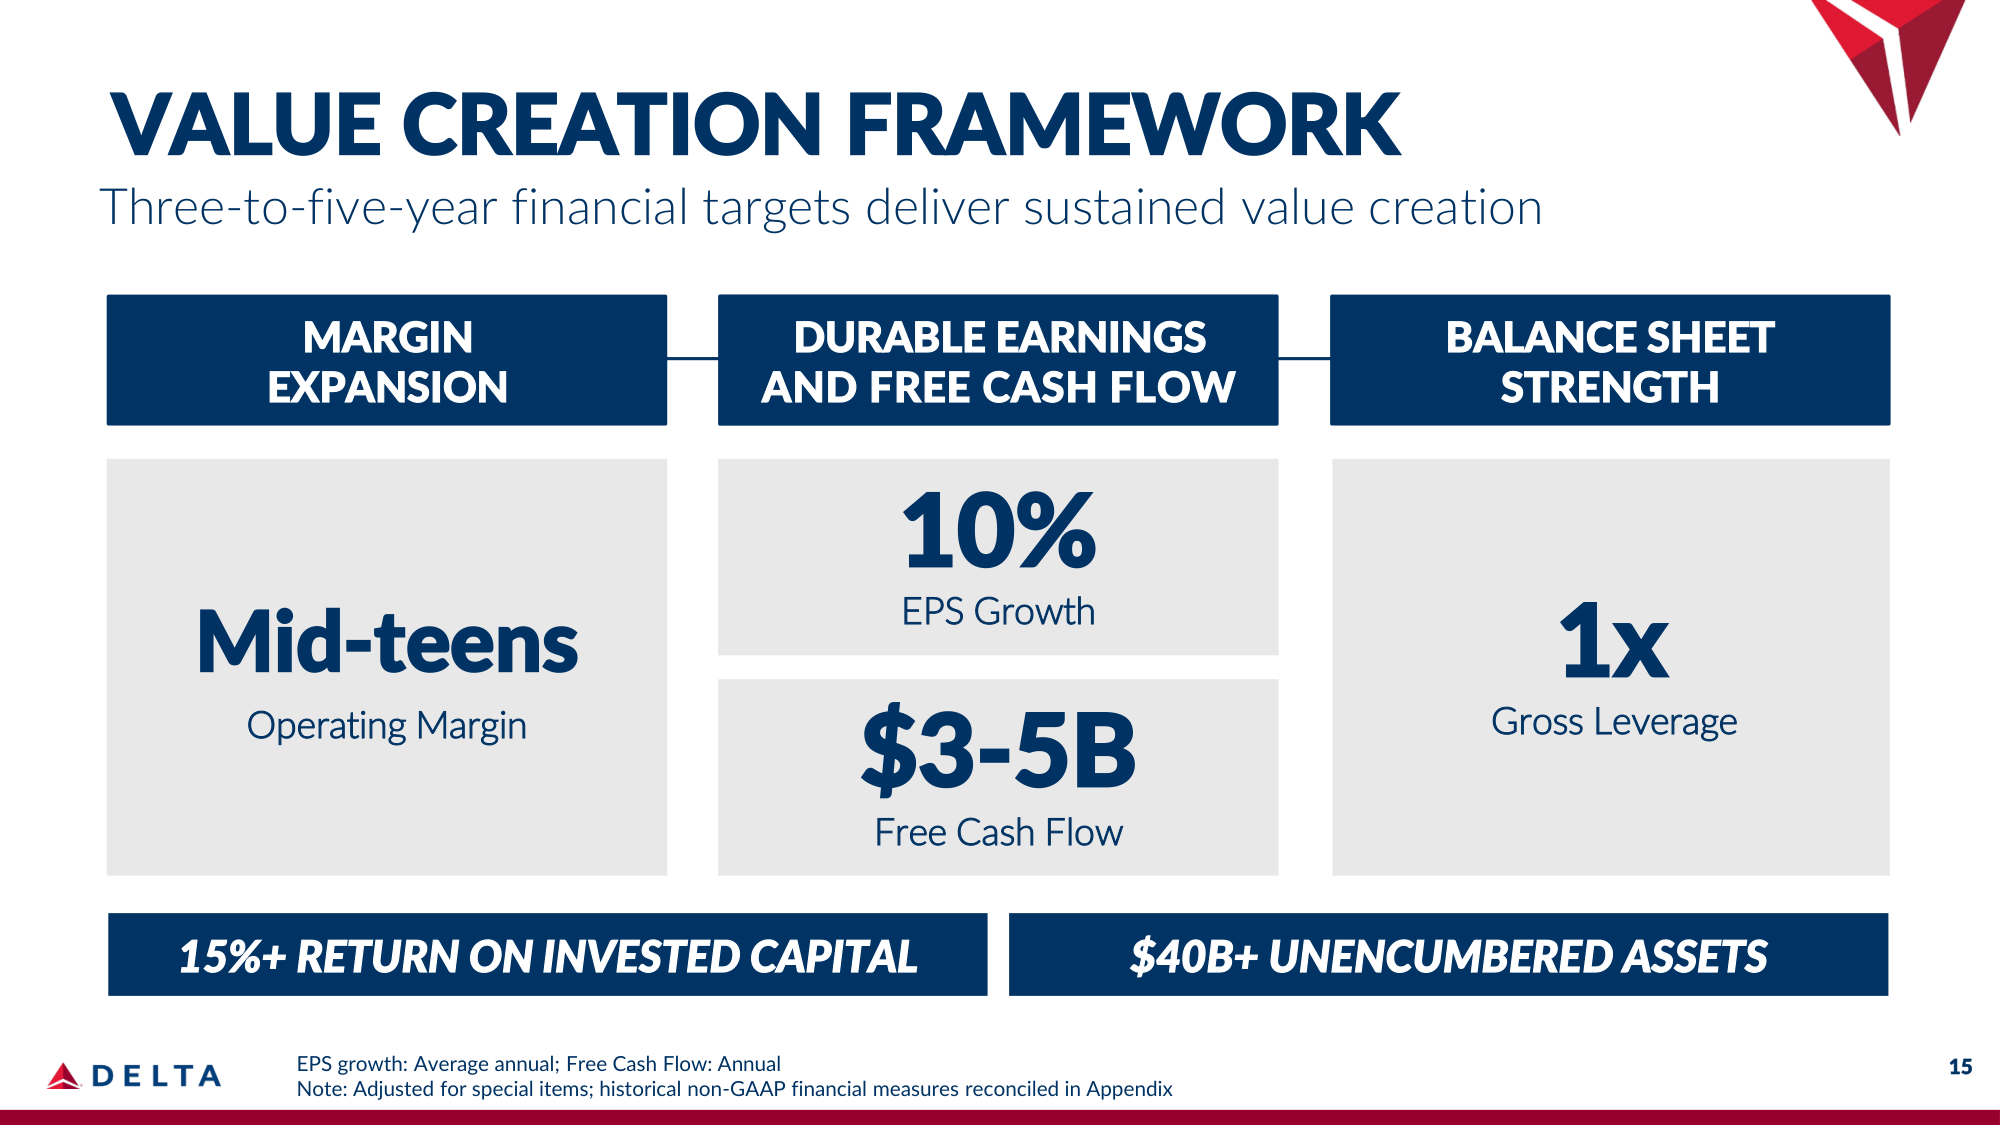
- Page 15 restates the three-to-five-year financial framework first set out at the November 2024 investor day: average annual EPS growth of 10% or more, a mid-teens operating margin, annual free cash flow of $3 billion to $5 billion, gross leverage of 1 times, return on invested capital of 15% or more, and more than $40 billion of unencumbered assets. The third-quarter adjusted operating margin was 9.4%, and the ROIC that management cited on the earnings call was 11%.
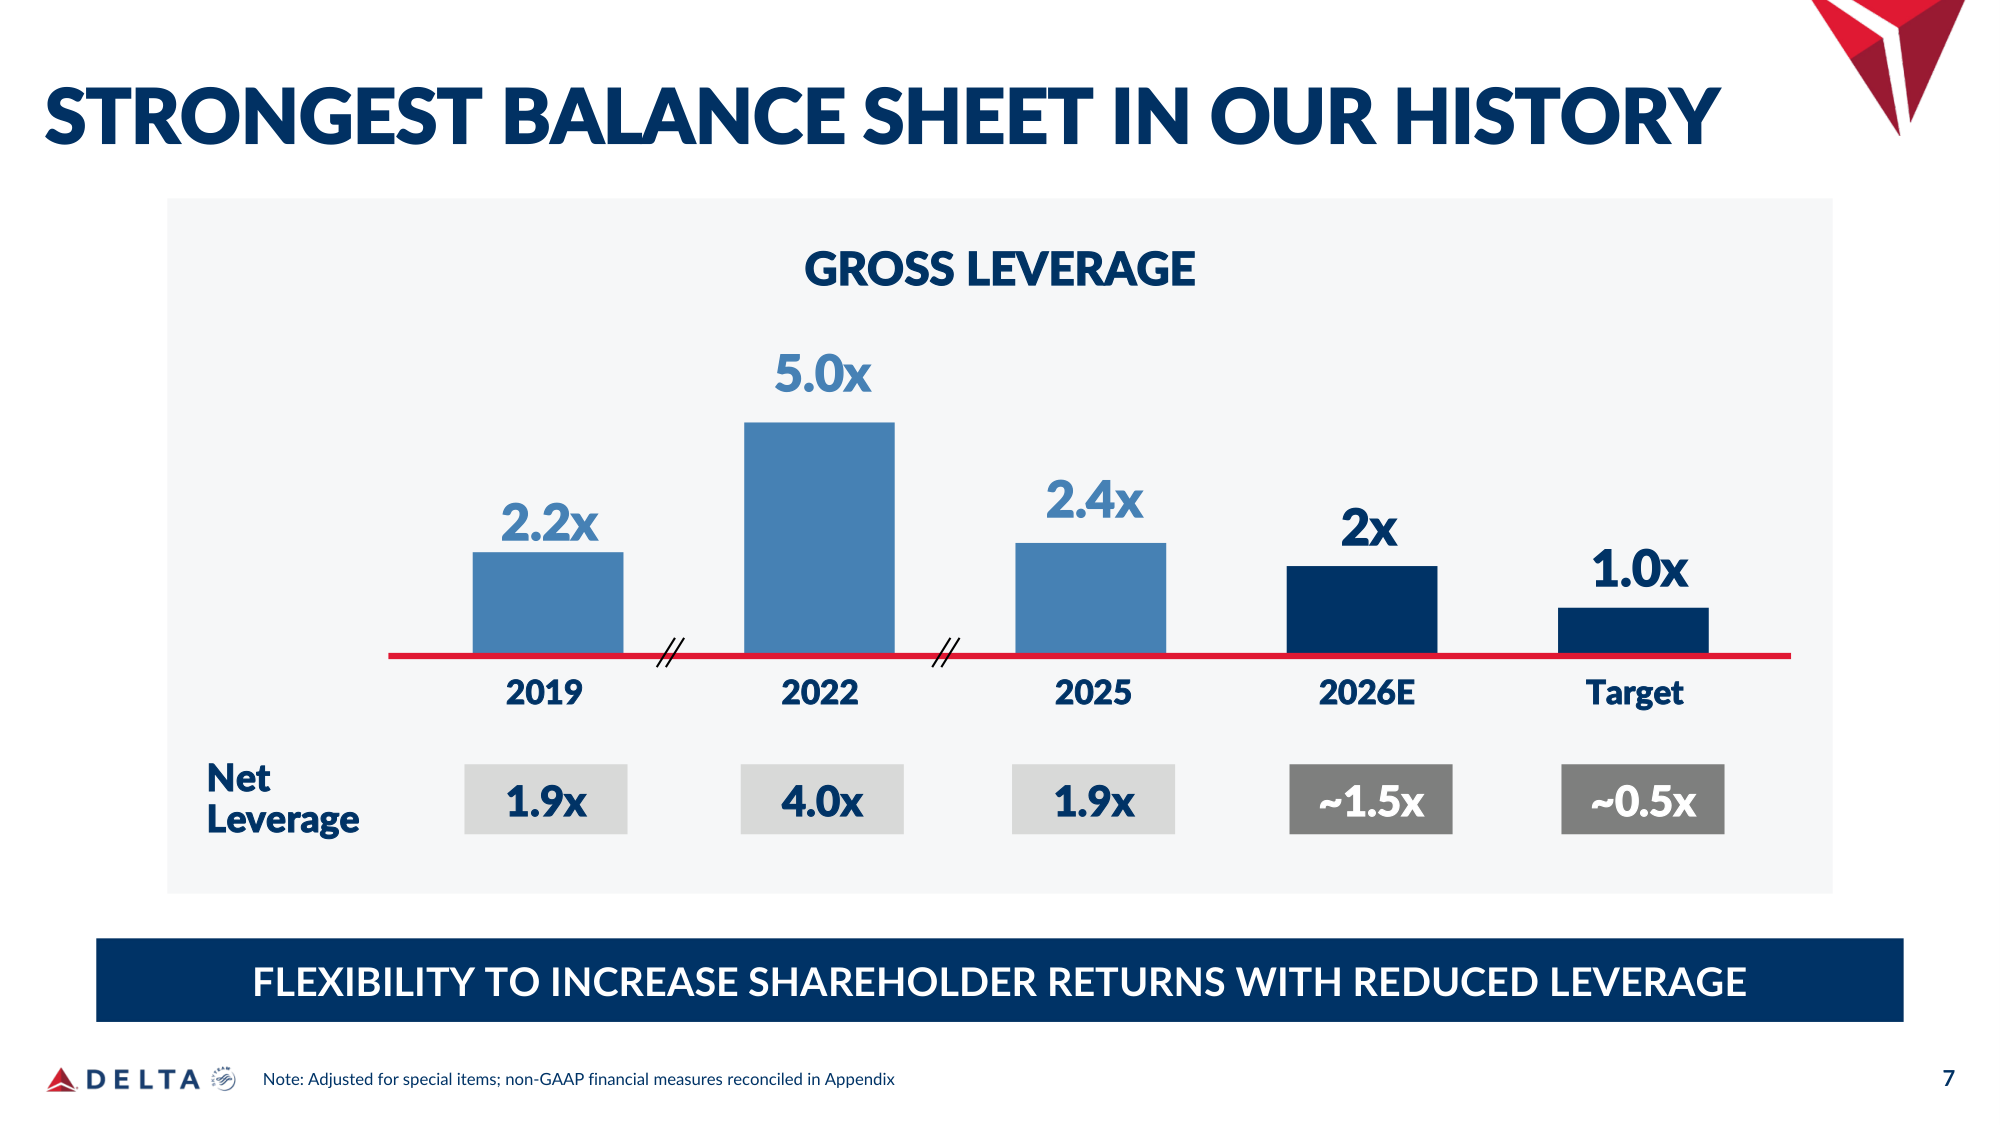
- Page 7 tracks gross leverage at 2.2 times in 2019, 5.0 times in 2022, and 2.4 times in 2025, with about 2 times projected for the end of 2026. The October guidance says about 2.2 times.
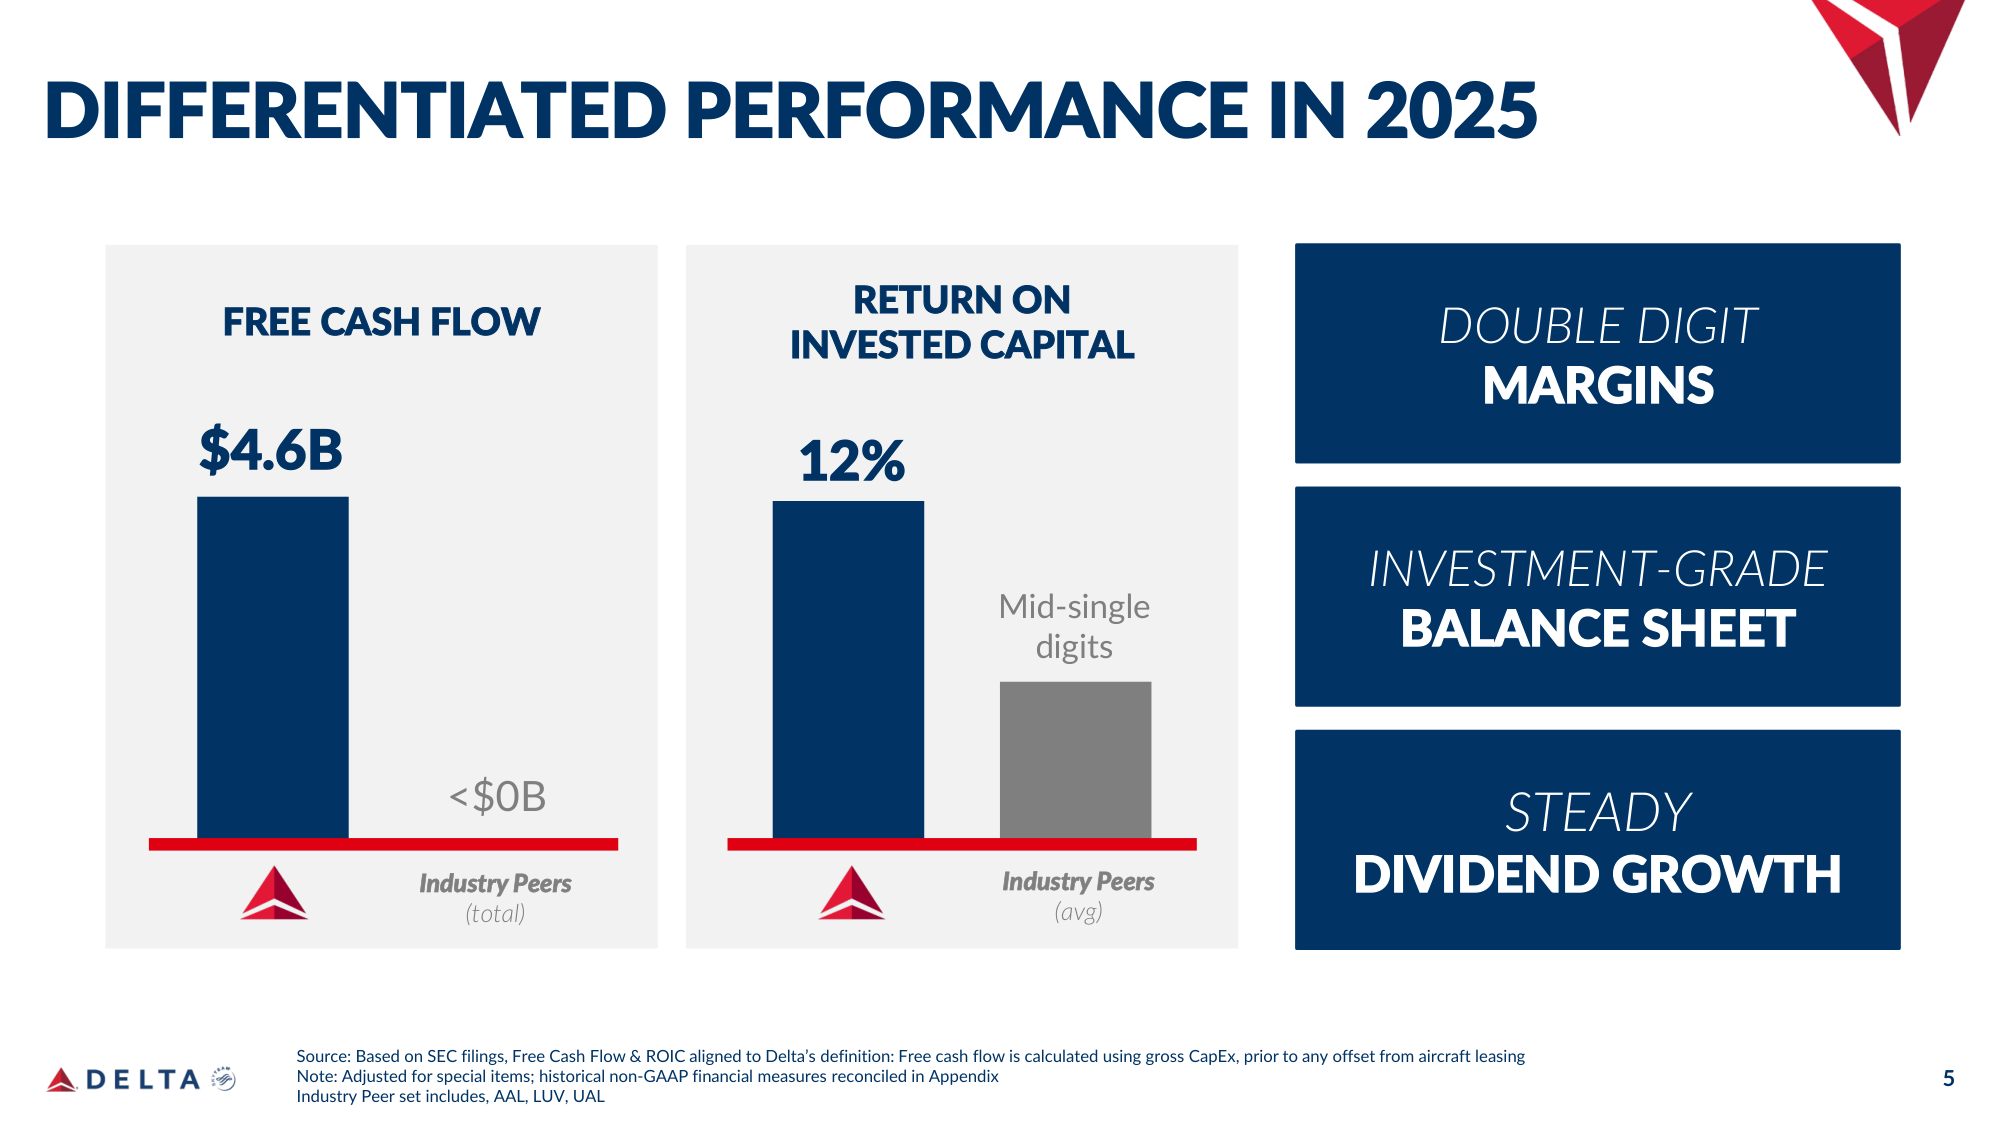
- Page 5 compares 2025 free cash flow of $4.6 billion against a combined figure below zero for American, Southwest, and United, and ROIC of 12% against a peer average in the mid-single digits. Page 6 says Delta's share of industry profit grew from 30% in 2014 and 40% in 2023 to more than 55% in 2025, premium revenue rose from $10 billion to $22 billion, and American Express remuneration rose from $2 billion to $8.2 billion against a $10 billion target.
- Page 16 lays out the capital allocation rule: $9 billion to $11 billion of annual operating cash flow, half reinvested in the business and half returned through debt reduction, dividends, and buybacks. Nine-month free cash flow reached $1.9 billion, so meeting the $2.5 billion full-year guide requires another $0.6 billion in the fourth quarter. None of the 2026 releases through the third quarter reports a share repurchase, and third-quarter capital expenditure rose 22% to $1.413 billion.
The Market Case for Delta
- The bullish case is that Delta earns money even when fuel spikes. Premium cabins, the American Express card partnership, and the refinery support profit, and the airline raises fares without adding seats to stay ahead of fuel. The bearish case starts from the fact that earnings guidance is still built on a fuel assumption, and that assumption broke within three months, taking the midpoint down 23.6%.
- Outside view (sell-side research aggregate, October 2026): The consensus of 45 analysts is Buy, with a 12-month price target of $105. The 2026 EPS estimate fell from $6.72 ninety days earlier to $5.41.
From Pandemic Losses to a Second Guidance Reset
- After Delta cut flying in March 2020, the dividend-adjusted weekly close fell to $18.47 in May. In January 2025 it guided full-year EPS above $7.35. The stock fell -15.0% in the first week of April, and the April 9 release declined to reaffirm annual guidance, citing current uncertainty.
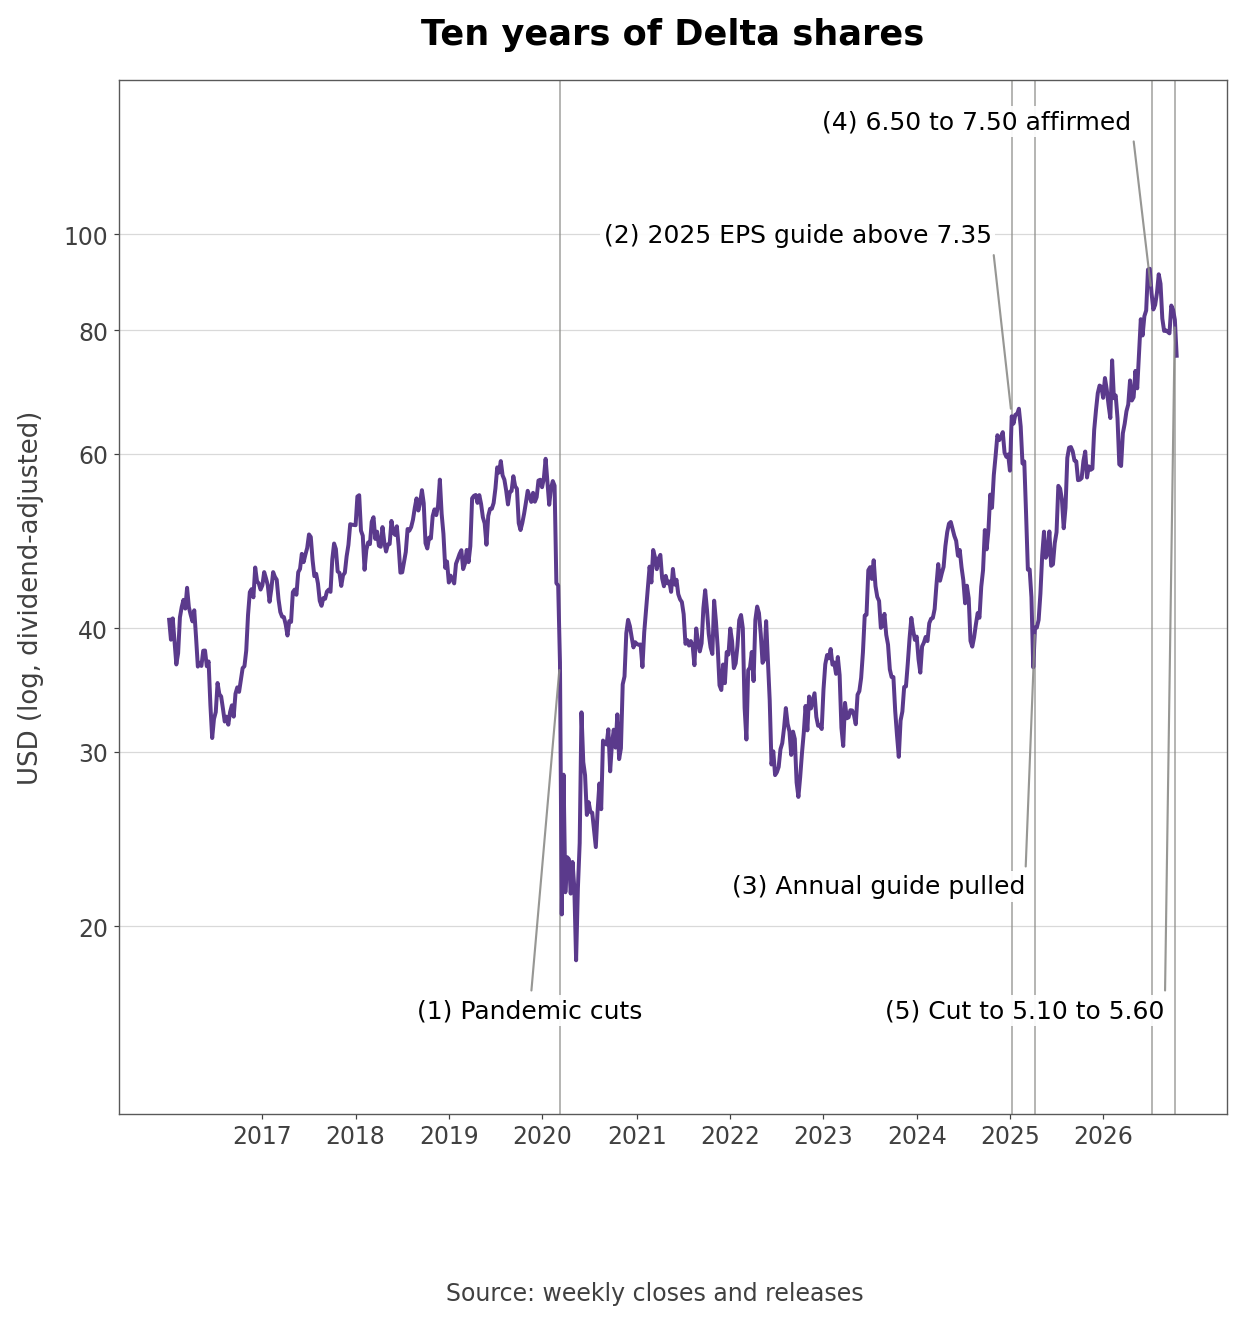
- Guidance came back in July 2025 at $5.25 to $6.25, rose to about $6 in October, and 2025 ended at $5.82. In January 2026 Delta guided $6.50 to $7.50 again. The April release gave second-quarter guidance only and no annual range. On July 10 the company reaffirmed $6.50 to $7.50, and the stock peaked the week before. After the October 9 cut, the stock fell -8.3% the following week, from $82.17 to $75.37.
How Often Has Delta Redrawn Its Annual EPS Guidance?
- Of the eight annual guidance statements, five drew a new range and two left the year without guidance. In 2025, guidance started above $7.35, was pulled, came back at $5.25 to $6.25, and ended with actual EPS of $5.82. In 2026, the $6.50 to $7.50 range disappeared in April, came back in July, and became $5.10 to $5.60 in October.
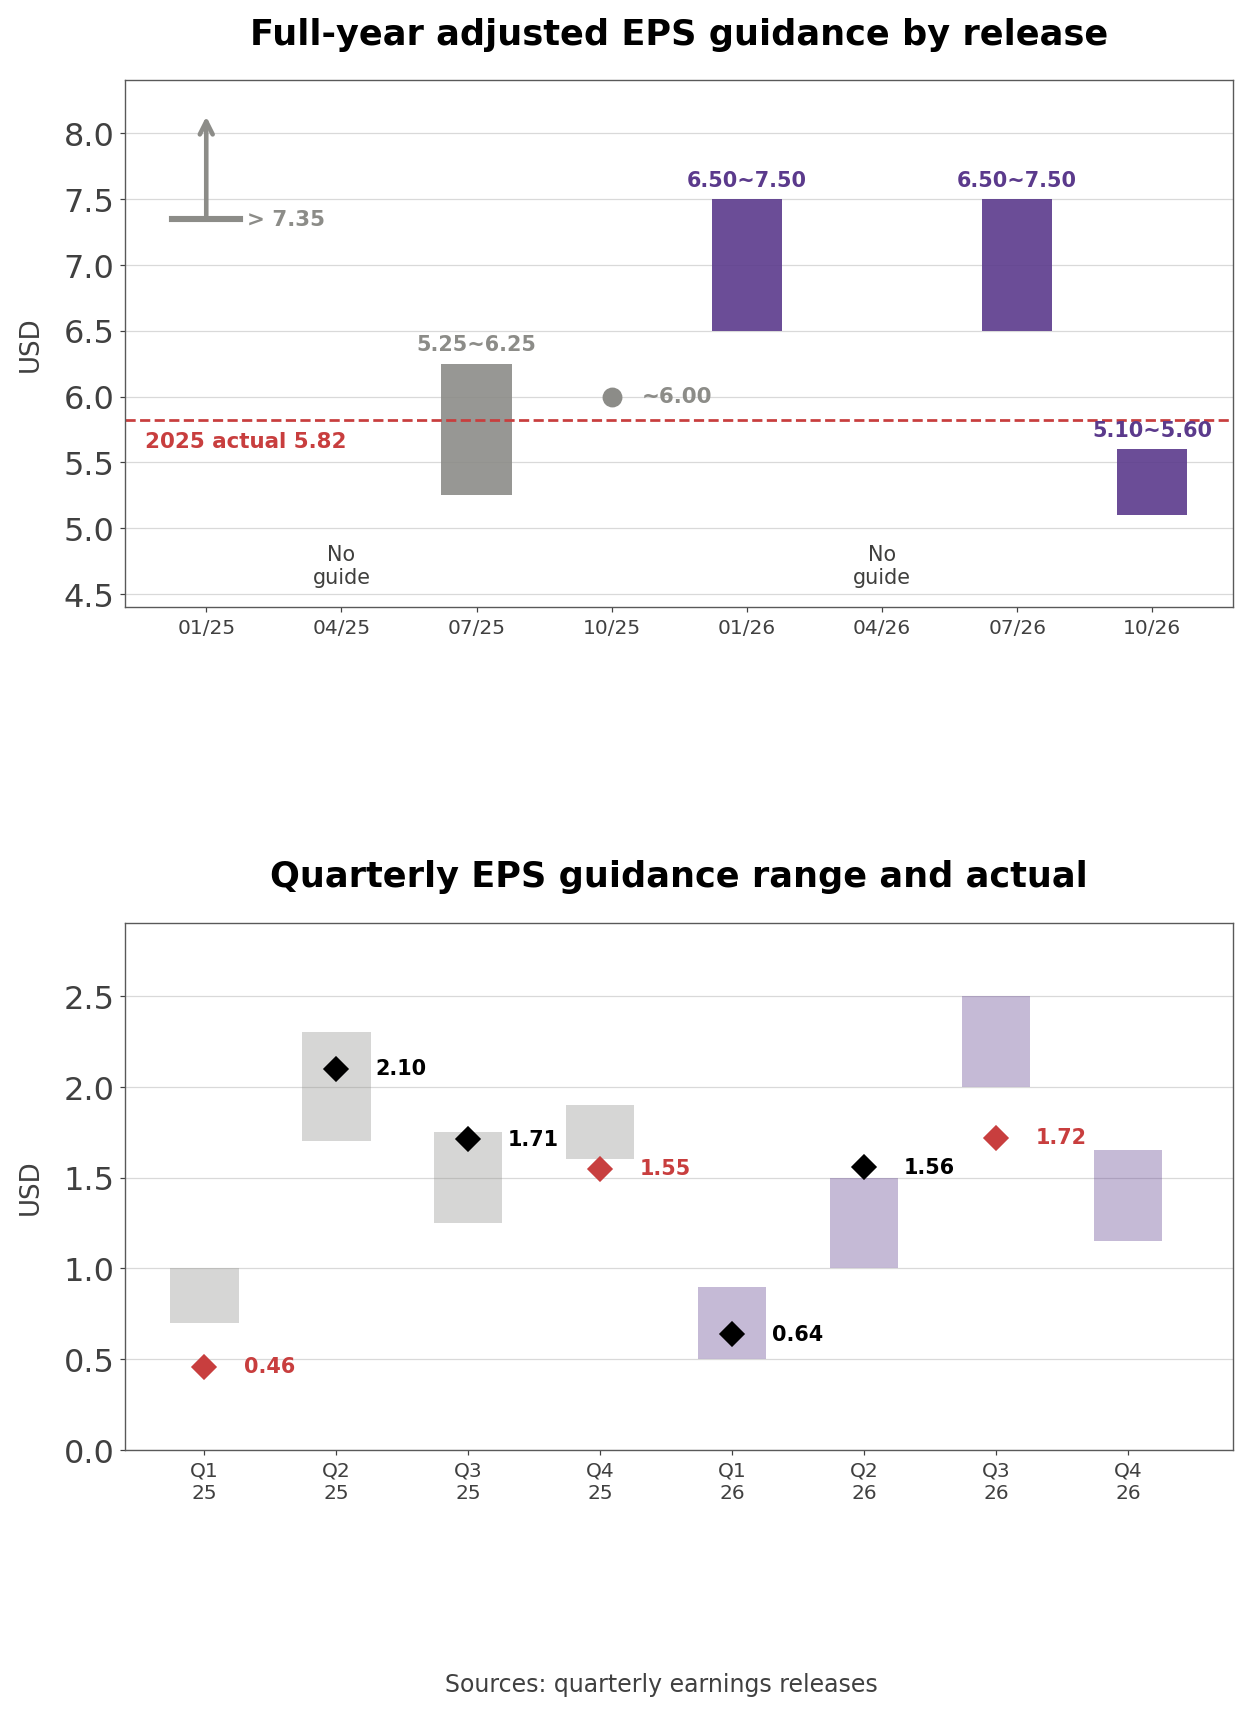
- Against quarterly guidance, three quarters landed below the low end: the first quarter of 2025 at $0.46 against $0.70 to $1.00, the fourth quarter of 2025 at $1.55 against $1.60 to $1.90, and the third quarter of 2026 at $1.72 against $2.00 to $2.50. The second quarter of 2026 went the other way, beating the top of its $1.00 to $1.50 range at $1.56.
- Own calculation (where the cut came from): Adding 2026 adjusted EPS of $0.64, $1.56, and $1.72 gives $3.92 for nine months, and adding the fourth-quarter guide of $1.15 to $1.65 gives $5.07 to $5.57, in line with the $5.10 to $5.60 annual range. The July midpoint of $7.00, less first-half EPS of $2.20 and the third-quarter guidance midpoint of $2.25, implied $2.55 for the fourth quarter. The October fourth-quarter midpoint is $1.40, $1.15 lower. Since the third quarter missed its guidance midpoint by $0.53, 69.7% of the $1.65 cut to the annual midpoint came from the fourth-quarter outlook.
The Gap Between Assumed and Actual Fuel Prices
- The third-quarter adjusted fuel price of $3.61 a gallon was +14.6% above the $3.15 assumed in July and 60.4% above the $2.25 of a year earlier. The second quarter went the opposite way, landing at $3.93 against a $4.30 assumption. In both quarters Delta built its assumption on the forward curve at the time of guidance.
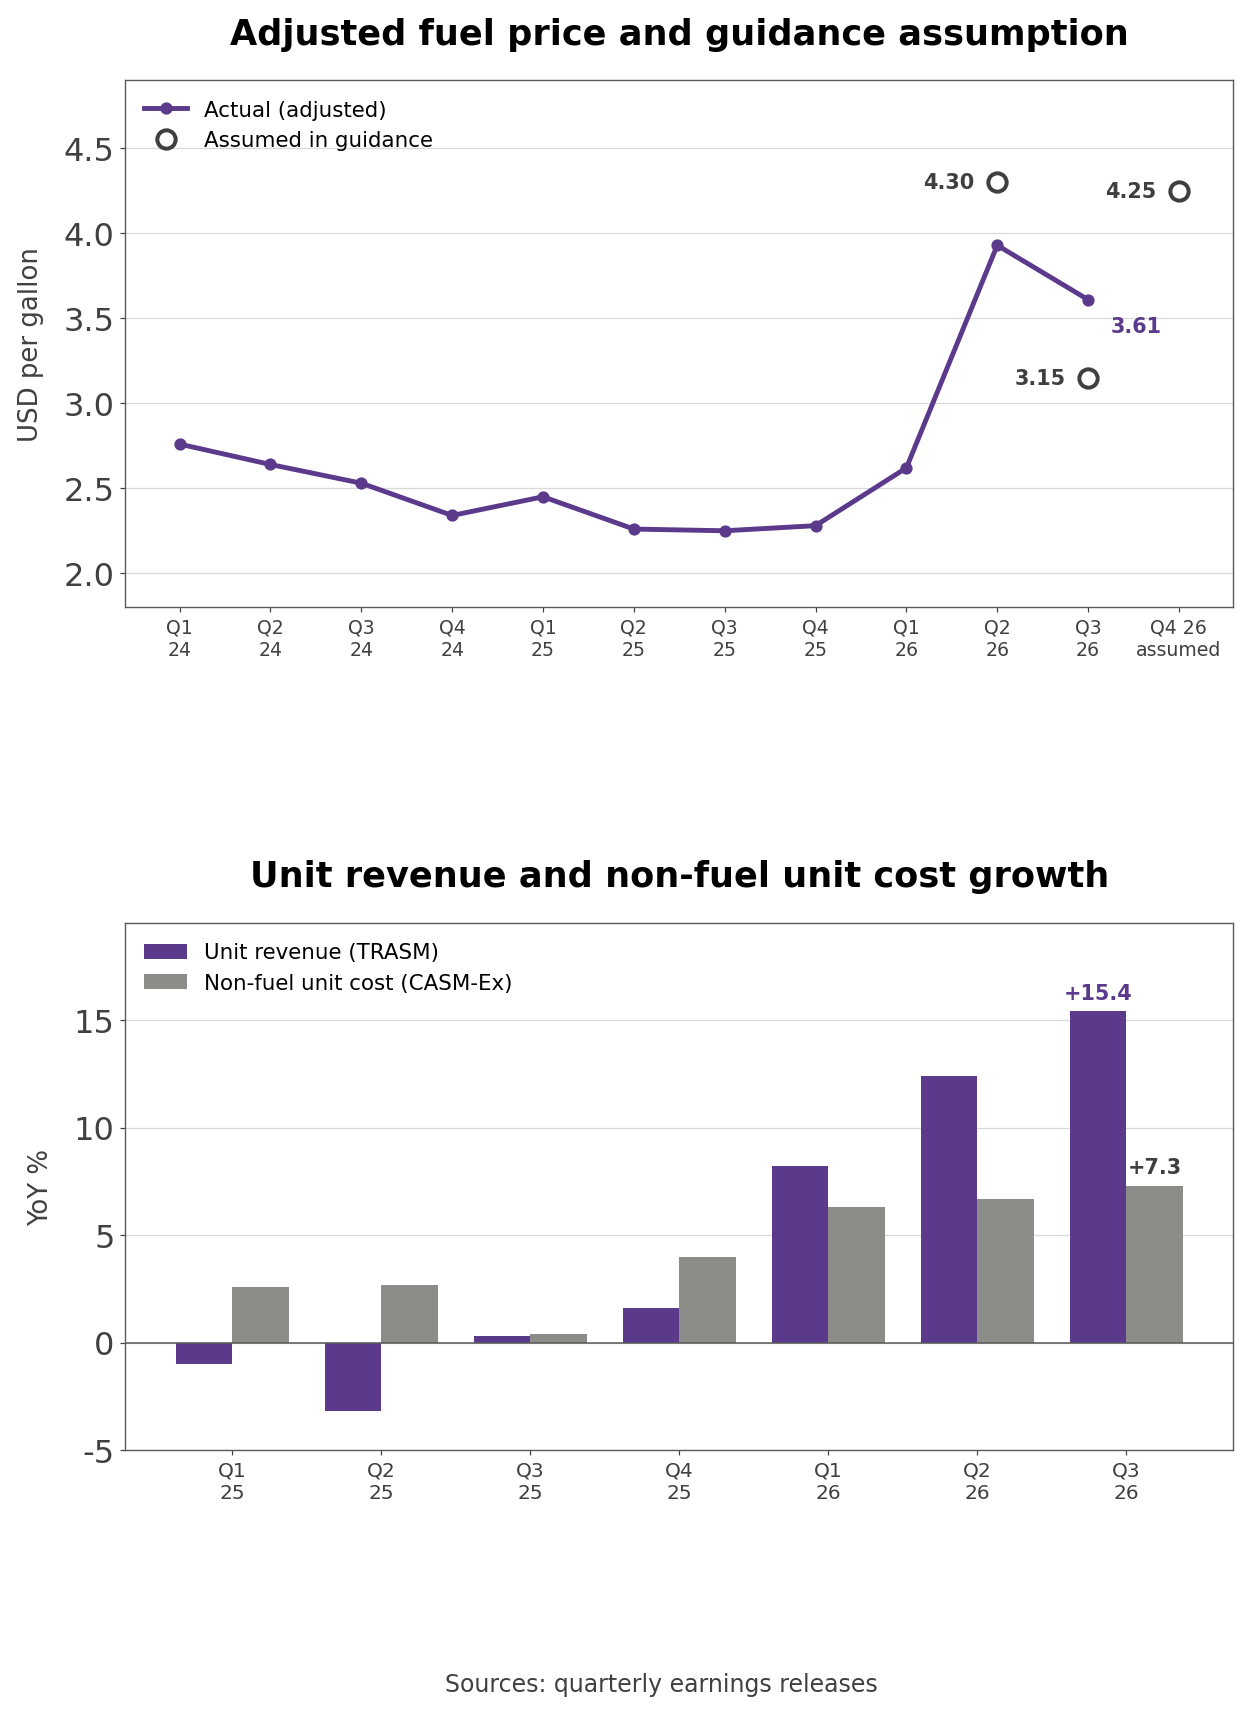
- Own calculation (cost of the fuel miss): Third-quarter adjusted fuel expense of $4.143 billion divided by $3.61 a gallon gives 1.148 billion gallons. Multiplying by the $0.46 gap gives $528 million, the same size as the "more than $500 million" the company cited.
- The refinery did not run to plan either. After a pause in July, it contributed only $0.13 a gallon in the third quarter. For the fourth quarter Delta assumes about $0.40, producing an all-in price of about $4.25. That is nearly double the $2.28 of the fourth quarter of 2025, and Delta still guided fourth-quarter pretax income of $1.2 billion. The third-quarter 10-Q records $716 million of settlement losses over nine months on fuel hedges held by Monroe Energy, the subsidiary that runs the refinery.
Fares Versus Non-Fuel Unit Costs
- Fares are how Delta pushed past fuel. Third-quarter adjusted total unit revenue (TRASM) rose +15.4%, three points faster than in the second quarter, and main cabin unit revenue rose 17% on fewer seats. For the fourth quarter Delta guided revenue up about 20% on seat growth below 2% that includes fewer main cabin seats. Management offered two reasons fares can keep rising: airfares are still well below cumulative inflation over the last several years, and the industry is cutting unprofitable capacity, which is helping main cabin trends.
- Costs rose too. Non-fuel unit cost (CASM-Ex) grew 7.3% in the third quarter, up from 6.3% in the first quarter and 6.7% in the second. Delta attributed it to capacity a few points below the original plan, higher crew and revenue-related costs, and summer operational disruption that added close to a point. The three-to-five-year framework calls for low-single-digit non-fuel unit cost growth, and Delta says it returns to that track in 2027.
Why GAAP Pretax Income Fell 40% While Adjusted Rose
- Third-quarter GAAP pretax income fell -40% to $1.074 billion, while adjusted pretax income rose 1% to $1.497 billion. The biggest line in the gap is the mark-to-market on equity investments, which swung from a $311 million gain a year earlier to a $218 million loss. Over nine months it was a $419 million loss against a $1.007 billion gain in the same period last year.
- The 10-Q shows the carrying value of those investments falling from $4.222 billion at the end of 2025 to $3.824 billion at the end of September. Delta's 11% stake in LATAM went from $1.644 billion to $1.516 billion and its 2% of China Eastern from $319 million to $156 million. Its 14.8% stake in Hanjin KAL, the holding company of Korean Air, rose from $861 million to $970 million.
How Delta Makes Money Beyond the Ticket
- Delta is based in Atlanta and runs its domestic network through hubs and key markets in Atlanta, Minneapolis-St. Paul, Detroit, Salt Lake City, New York, Los Angeles, Seattle, and Boston. It operates up to 5,500 daily flights to more than 300 destinations on six continents, employs 100,000 people, and carried more than 200 million customers in 2025. The 10-Q lists 1,005 mainline aircraft at the end of September with an average age of 14.9 years, plus 325 regional jets flown by its subsidiary Endeavor and by SkyWest and Republic.
- Third-quarter passenger revenue was $15.534 billion. Premium cabins brought in $6.818 billion, up 17.6%, which edged past the main cabin's $6.802 billion, up 12.2%, by $16 million. Award travel added $1.302 billion and travel-related services such as baggage $612 million. Delta grew premium seats 6% and still posted double-digit premium unit revenue growth. The March deck puts premium revenue at $22 billion for 2025, up from $10 billion in 2014.
- Loyalty revenue rose 19% to $1.346 billion. American Express remuneration grew 15%, and Delta expects it to exceed $9 billion for the year. Co-brand card acquisitions and spend both grew at double-digit rates, the eighth consecutive quarter of double-digit growth in cardholder spend, and the company is on track for a fifth straight year of 1 million new cards. Cargo revenue rose 29% to $301 million and maintenance, repair, and overhaul (MRO) revenue rose 28% to $296 million, bringing nine-month MRO revenue to $990 million. Delta says these diversified streams now make up 61% of revenue.
- Refinery sales of $2.601 billion, up 76%, are counted in GAAP revenue and excluded from adjusted revenue. Delta bought the Trainer refinery in 2012, and Monroe Energy sells its products to third parties. For Delta the value of the refinery lies less in that revenue than in lowering its own fuel cost, and Delta guided the full-year benefit at more than $700 million.
- By region, domestic revenue of $10.594 billion grew 16%, transatlantic $3.317 billion grew 11%, Latin America $867 million grew 14%, and transpacific $756 million grew 13%. New routes starting in 2027 include Seattle to Tokyo-Narita, Los Angeles to Manila, Austin to Paris, Detroit to Athens, and Boston to Venice. Overseas reach comes through partners: Delta is a founding member of SkyTeam and works with Air France-KLM, Virgin Atlantic, Korean Air, LATAM, Aeromexico, China Eastern, and WestJet, several of which are among the equity stakes above.
- The customer base skews toward higher incomes. Management says the top 40% of US households make up the majority of Delta's customers and are nearly $40 trillion wealthier than a few years ago, and the release cites a corporate survey in which over 90% of respondents expect their corporate travel to increase or stay the same in 2027. On the cost side, profit sharing is distinctive: Delta accrued nearly $900 million in the first nine months toward next February's employee payout, a cost that rises with earnings.
How Delta Compares With Three US Peers
- Over the trailing twelve months, revenue was $71.8 billion for Delta, $62.9 billion for United, $58.3 billion for American, and $30.1 billion for Southwest, and Delta's growth of +14.1% was the highest. Delta's figure includes third-party refinery sales, and adjusted revenue over the last four quarters adds up to $64.1 billion. Its market value of $49.32 billion is 1.6 times United's $31.19 billion, while forward P/E multiples are close: 11.43 times for Delta, 10.90 times for United, and 12.63 times for Southwest.
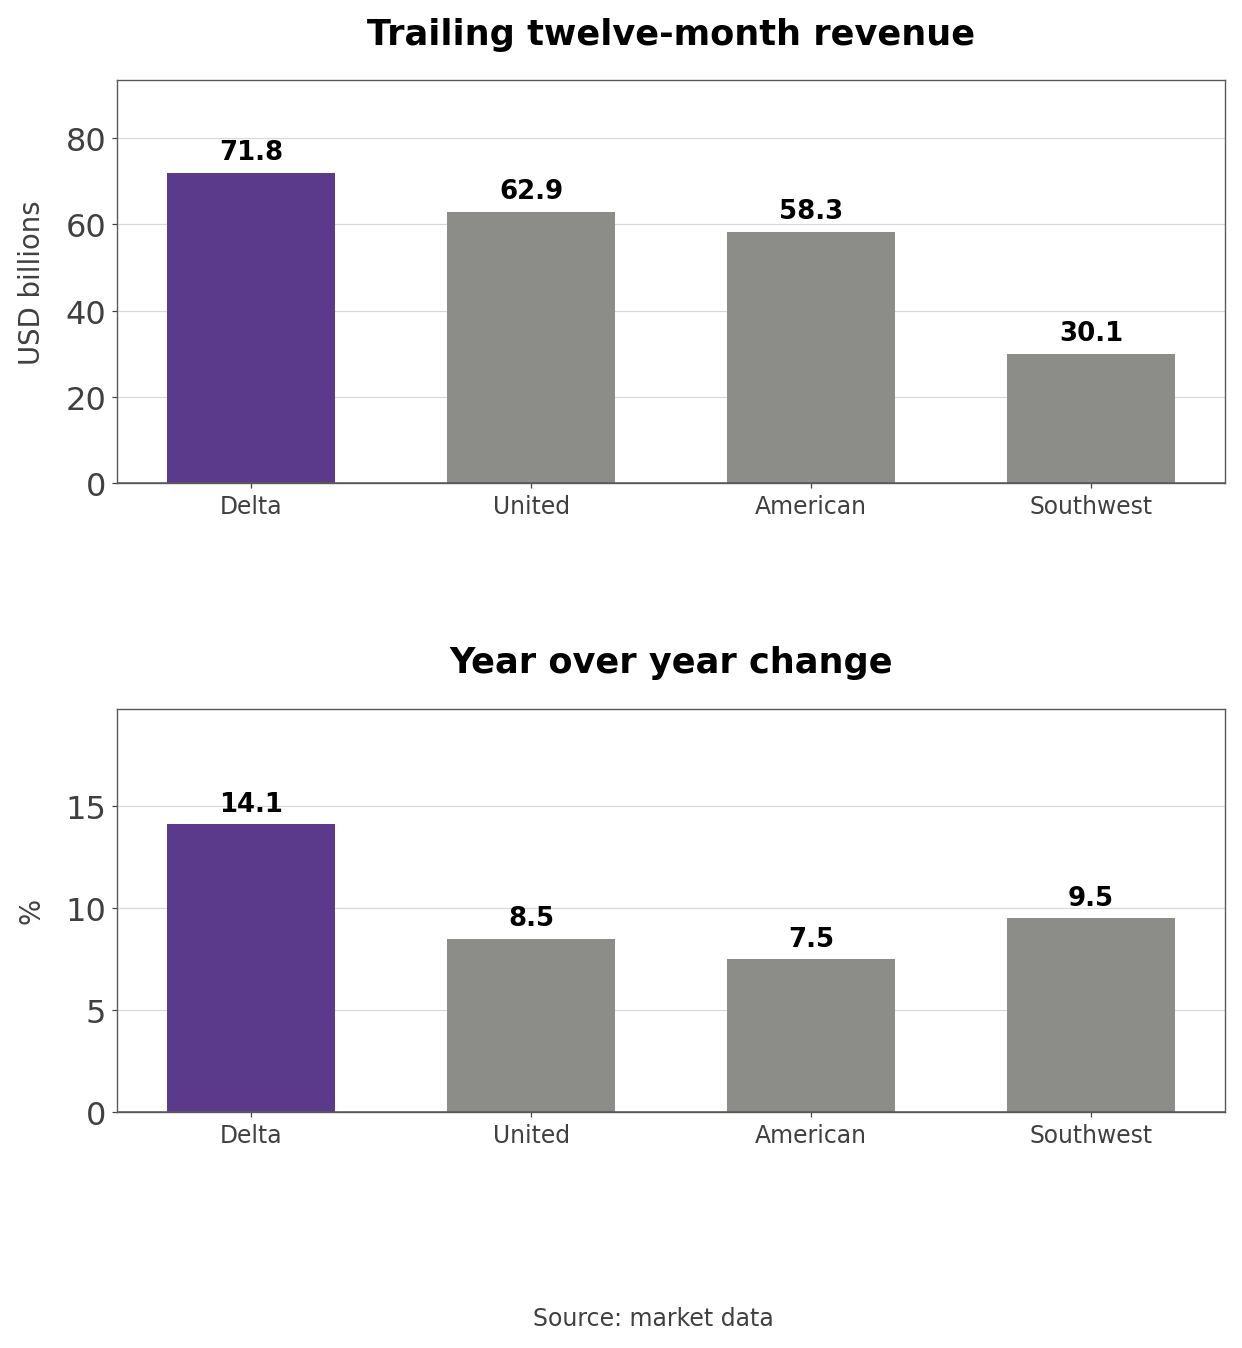
- Price to sales is 0.69 times for Delta, 0.64 times for Southwest, 0.50 times for United, and 0.13 times for American. Over one year, Delta rose +32.8%, Southwest +32.7%, United 2.2%, and American fell -9.5%. American has lost money over the trailing twelve months, so it has no meaningful P/E.
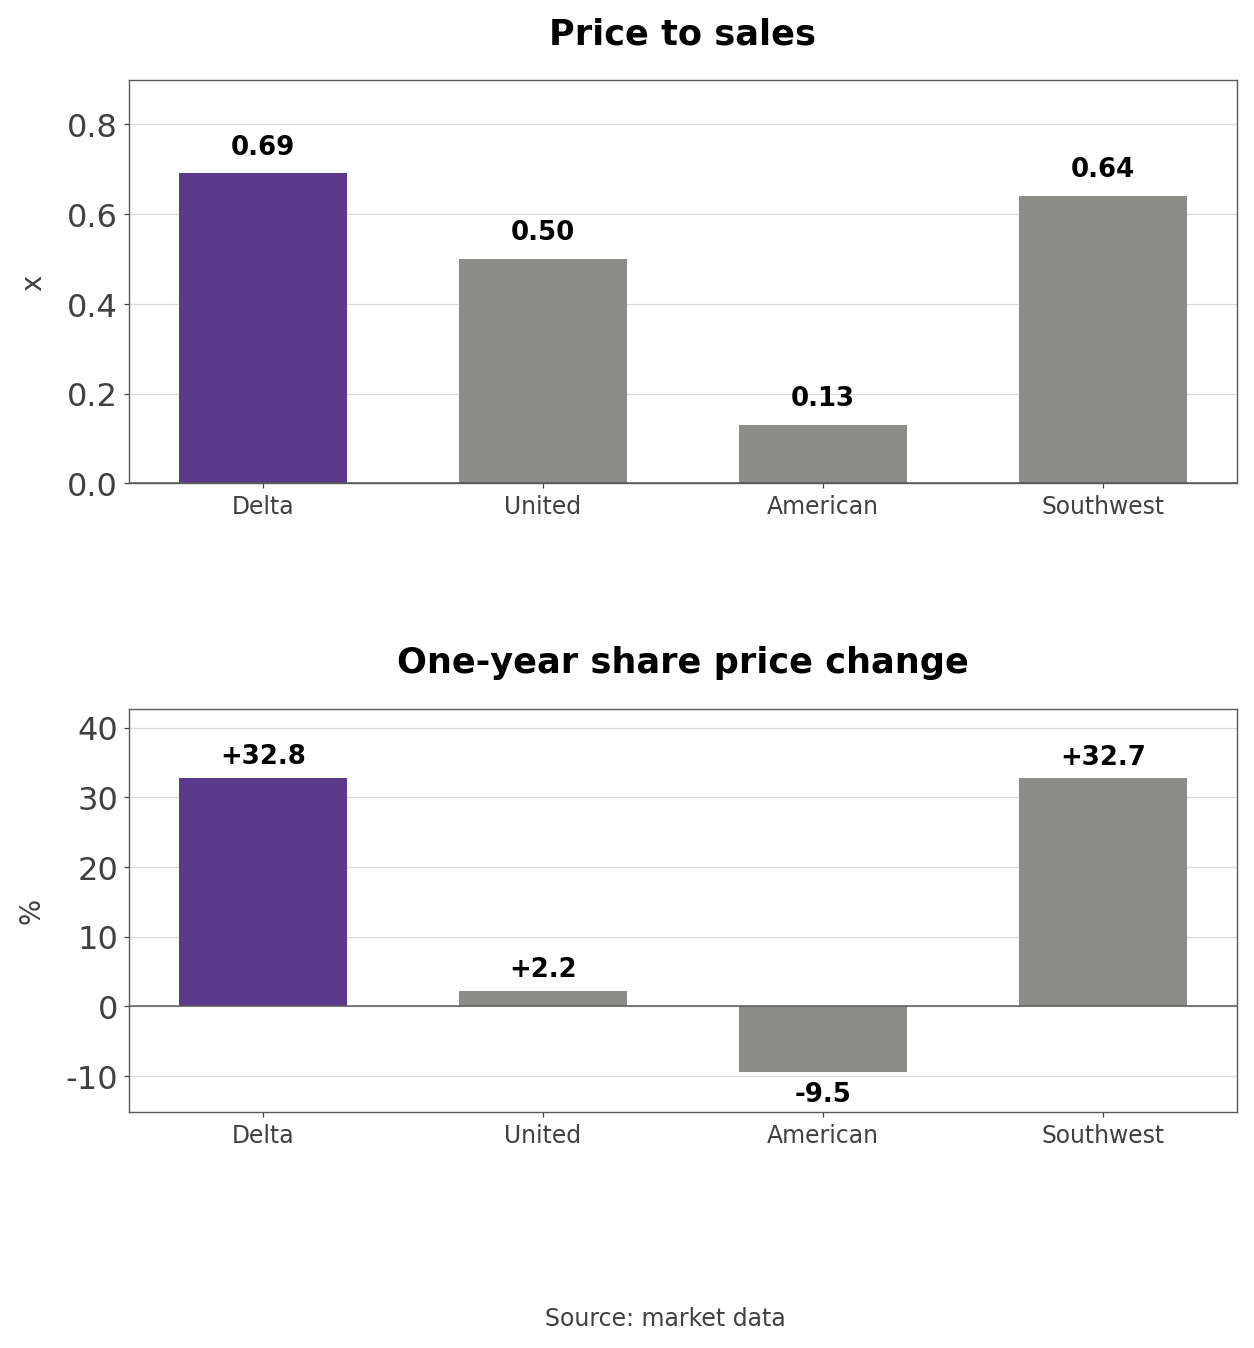
- Returns on capital separate them. In Delta's own comparison, its 2025 ROIC of 12% is roughly twice the peer average in the mid-single digits, and the 11% cited for the third quarter is still above what management calls its cost of capital. The one-year share price ranking, with Delta and Southwest ahead and United and American behind, runs in the same direction as that ROIC comparison.
DAL P/E on Adjusted EPS Over 44 Months
- On adjusted EPS, Delta trades at 13.78 times, just above the 90th-percentile mark of 13.77 times over 44 months, against a median of 8.66 times. Price to adjusted revenue of 0.78 times is also above its 0.59 times median. The highest month-end reading was 17.15 times in June 2026, just before the share price peak, and the lowest was 4.85 times in October 2023.
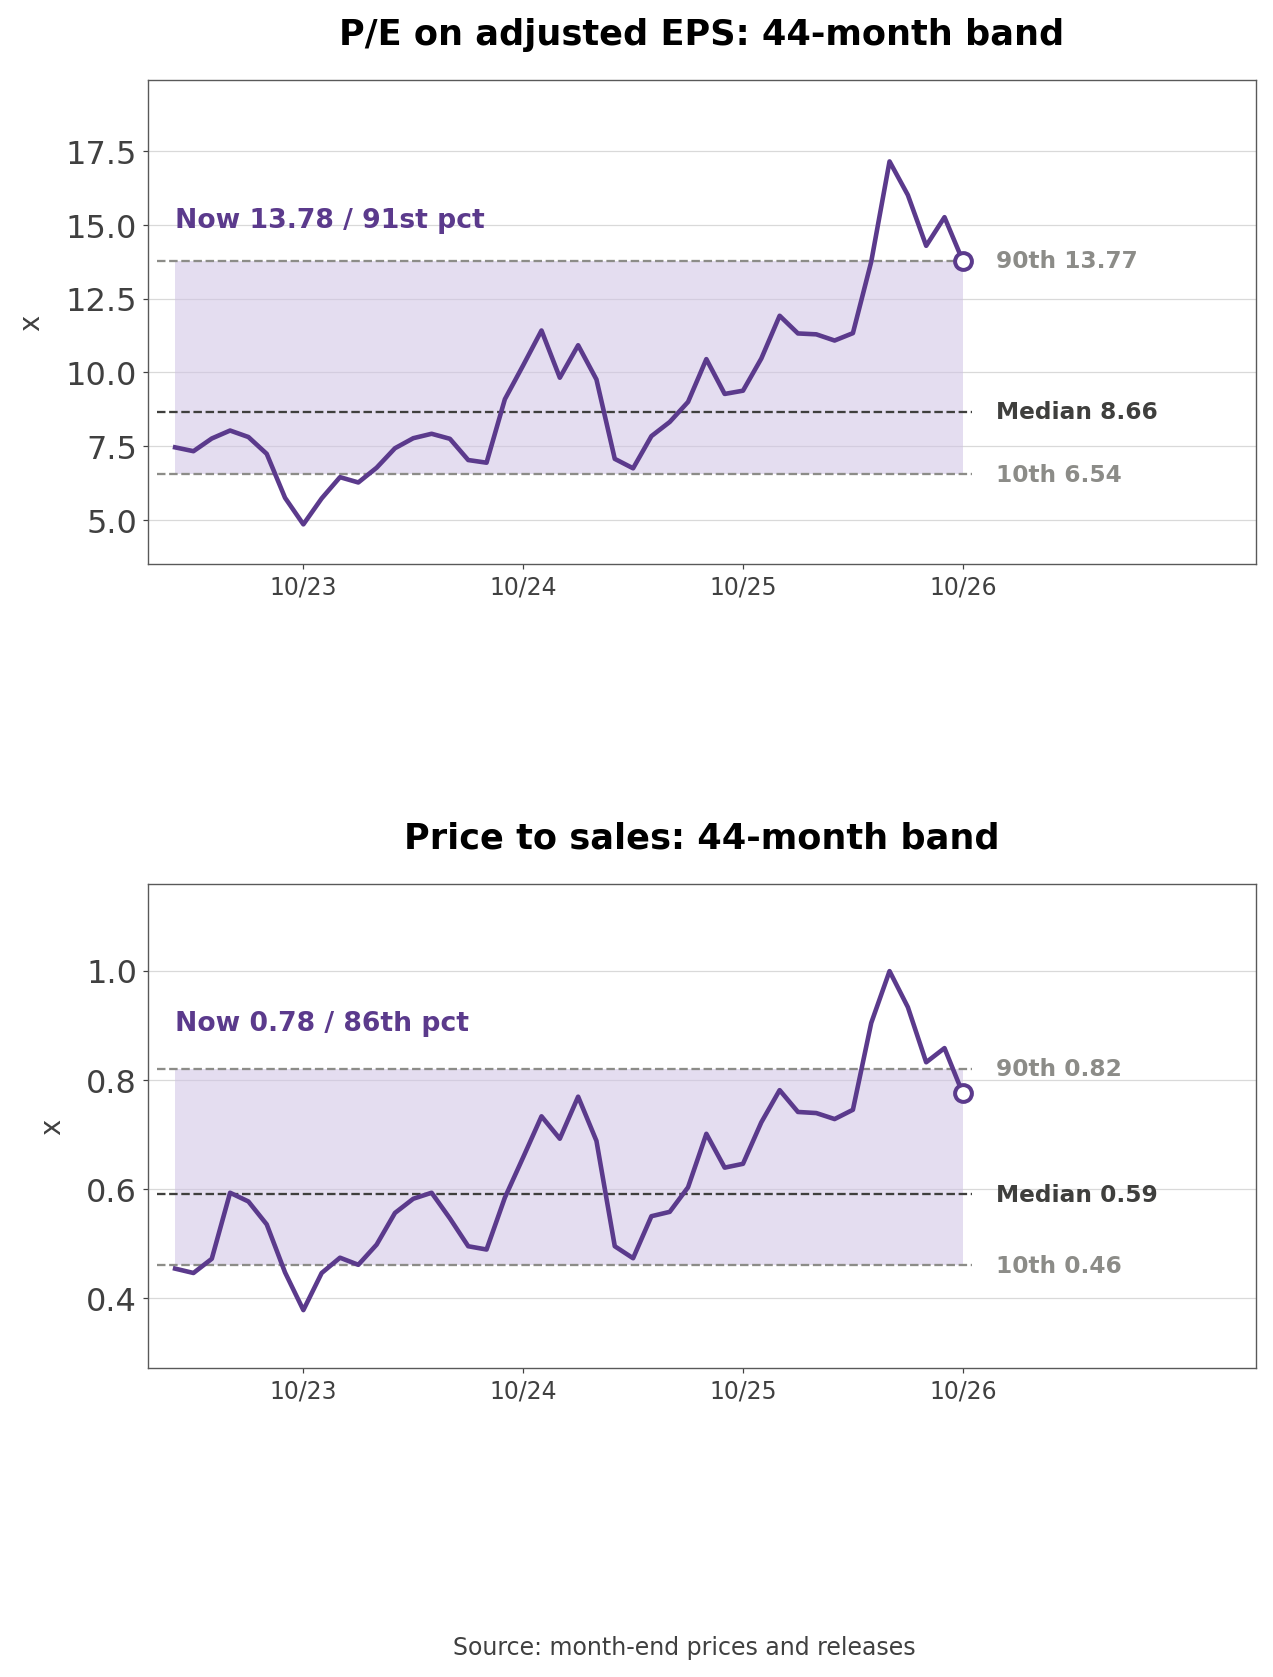
- Trailing four-quarter adjusted EPS of $1.55, $0.64, $1.56, and $1.72 adds up to $5.47, and $75.37 divided by $5.47 gives 13.78 times. On the new guidance midpoint of $5.35, the multiple is 14.09 times.
- The band starts in March 2023 because that is roughly when trailing adjusted EPS turned positive again once the pandemic loss quarters rolled off. After a 23.6% guidance cut, the multiple still sits near the top of its band, which suggests the market is pricing this earnings decline as a fuel-driven, temporary dip.
Three Conditions That Move the Stock
- The fuel price comes first. Fourth-quarter guidance assumes $4.25 a gallon, including a refinery benefit of about $0.40. If the actual price again runs $0.46 above the assumption, as it did in the third quarter, roughly $500 million comes out of a quarter's profit; if it lands below, the quarter looks like the second quarter, which beat the top of its range.
- Fare pass-through is the second. With unit revenue up 15.4% and non-fuel unit cost up 7.3%, roughly twice as fast, Delta can stay ahead of fuel. Delivering fourth-quarter revenue growth of about 20% on seat growth under 2% would keep that gap open, and whether fares hold once fuel eases, as management expects, decides 2027 earnings.
- The return to financial targets is the third. Delta plans to use about $2.5 billion of free cash flow this year to repay more than $2 billion of debt and bring gross leverage to about 2.2 times, still above both the 1 times target and the roughly 2 times shown in March. It raised the quarterly dividend 14.7% to $0.2150 and reports no buybacks. The pace of deleveraging sets the timing of larger shareholder returns.
What the Fourth-Quarter Report Should Show
- The first figures to check are whether the actual fourth-quarter fuel price stayed within the $4.25 assumption and whether the refinery benefit recovered to about $0.40. Next come revenue growth against the roughly 20% guide, whether non-fuel unit cost growth improved by the 1 to 2 points management expects, and whether full-year free cash flow reached about $2.5 billion.
- One question this piece cannot settle is what fuel assumption 2027 guidance will rest on. Both 2025 and 2026 guidance were shaken within months by fuel and macro conditions, and management says revenue strength will outlast high fuel. If fuel offers no help next year, can fares and non-ticket revenue alone get Delta back to the 10% EPS growth in its framework?
Related Analysis
- American Express (AXP) Stock Analysis: Credit Metrics Reset: the card issuer behind Delta's co-brand SkyMiles cards, useful for seeing how the remuneration Delta expects to exceed $9 billion this year looks from the other side of the partnership.
- Casey's (CASY) Stock Analysis: Fuel Margin Drove Q4 Profit: a fuel seller whose profit moved with fuel margins, a useful contrast with an airline whose guidance moves with the fuel price it pays.
#DeltaAirLines #DAL #DALStock #AirlineStocks #JetFuel #TravelStocks #USStocks #StockAnalysis #EquityResearch #GlobalStockBrief
'US Stock Analysis' 카테고리의 다른 글
| Vertex (VRTX) Stock: 96% CF Revenue and a $10B Deal (0) | 2026.10.20 |
|---|---|
| T-Mobile (TMUS) Stock: Phone Metrics It Stopped Reporting (0) | 2026.10.19 |
| KLA (KLAC) Stock: Net Income Up 19% and Cash Flow Flat (0) | 2026.10.18 |
| Halozyme (HALO) Stock: 2033 Convertible Notes, Dilution (0) | 2026.09.21 |
| Illumina (ILMN) Stock Analysis: Organic Growth vs M&A (0) | 2026.09.20 |


