
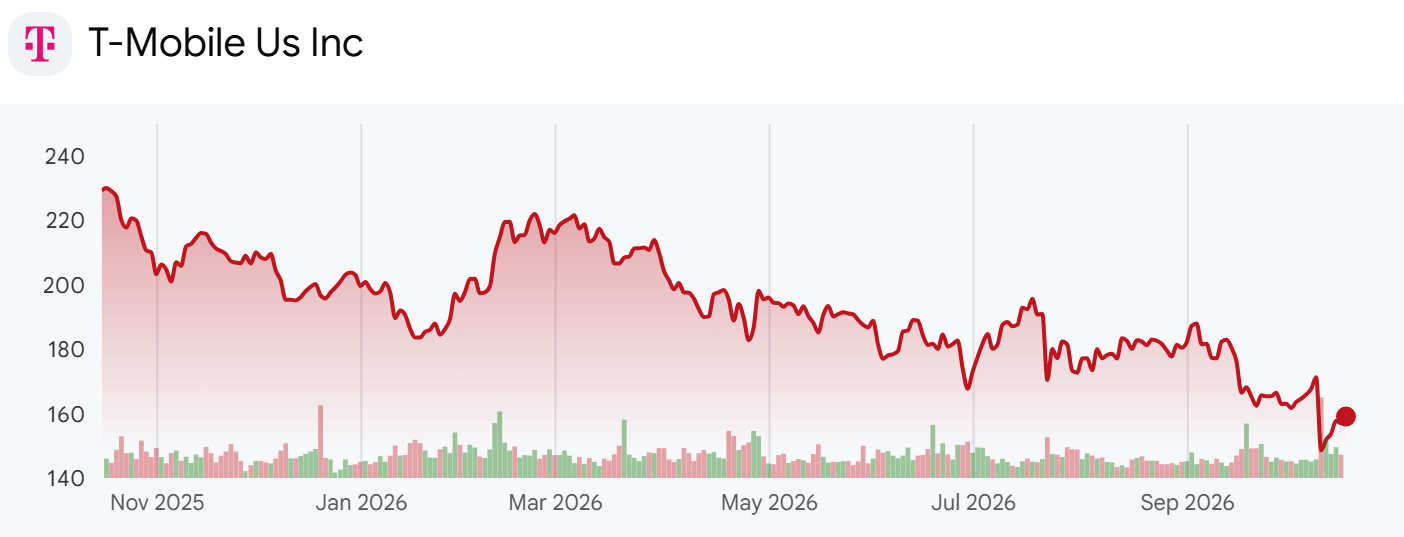
- T-Mobile US, Inc. (NASDAQ: TMUS) added 277,000 postpaid accounts in the second quarter of 2026, -12.9% from a year earlier, while service revenue grew +8.9% to $18.98 billion and Core Adjusted EBITDA grew +11.7% to $9.54 billion. Starting with the first quarter of 2026, the company stopped reporting postpaid phone net additions and phone churn, and the last phone churn figure it published, for the fourth quarter of 2025, was 1.02%, up from 0.92% a year before. Of the 3.2 million postpaid accounts T-Mobile added over the past year, 65.1% came through acquisitions. The shares closed at $159.10, -39.0% below the February 2025 weekly closing high of $260.99.
- T-Mobile is one of the three national wireless carriers in the United States, and it reached its current size by merging with Sprint in 2020. Nothing in the company's filings explains why telecom stocks fell together in the week that included October 9, so this piece stays with what the investor factbooks, 10-Qs, and 10-Ks report.
T-Mobile's Raised 2027 Targets
- On February 11, alongside fourth-quarter results, T-Mobile held a Capital Markets Day update and raised the multi-year plan it first laid out in September 2024. The release headline said the company "Raises the Bar."
- Company disclosure (February 11, 2026 Capital Markets Day update release): Service revenues are expected to be approximately $77.0 billion in 2026 and $80.5 billion to $81.5 billion in 2027. Core Adjusted EBITDA is expected at $37.0 billion to $37.5 billion in 2026 and $40.0 billion to $41.0 billion in 2027, and Adjusted Free Cash Flow at $18.0 billion to $18.7 billion in 2026 and $19.5 billion to $20.5 billion in 2027. The company targets 18 million to 19 million broadband customers by 2030, made up of 15 million 5G broadband and 3 million to 4 million fiber customers.
- The same release reported a halftime scorecard. From 2023 to 2025, the compound annual growth rate was 6% for service revenues, 8% for Core Adjusted EBITDA, and 15% for Adjusted Free Cash Flow. The company also expects digitalization and AI to add nearly $3 billion to Core Adjusted EBITDA by the end of 2027, relative to 2025.
- Reaching the 2027 midpoints asks for slightly faster growth than the scorecard. Service revenues have to grow about 6.6% a year from $71.31 billion in 2025 to $81.0 billion, and Core Adjusted EBITDA about 9.3% a year from $33.92 billion to $40.5 billion.
- Page 13 of the second-quarter investor factbook, released July 23, updated two lines of the 2026 outlook. Net cash from operating activities moved to $28.4 billion to $28.8 billion and Adjusted Free Cash Flow to $18.4 billion to $18.8 billion, both up $200 million at the midpoint. Postpaid net account additions of 950,000 to 1.05 million, Core Adjusted EBITDA of $37.1 billion to $37.5 billion, capital expenditures of about $10.0 billion, and an effective tax rate of 25% to 26% were unchanged. CFO Peter Osvaldik attributed the cash flow increase to lower cash income taxes.
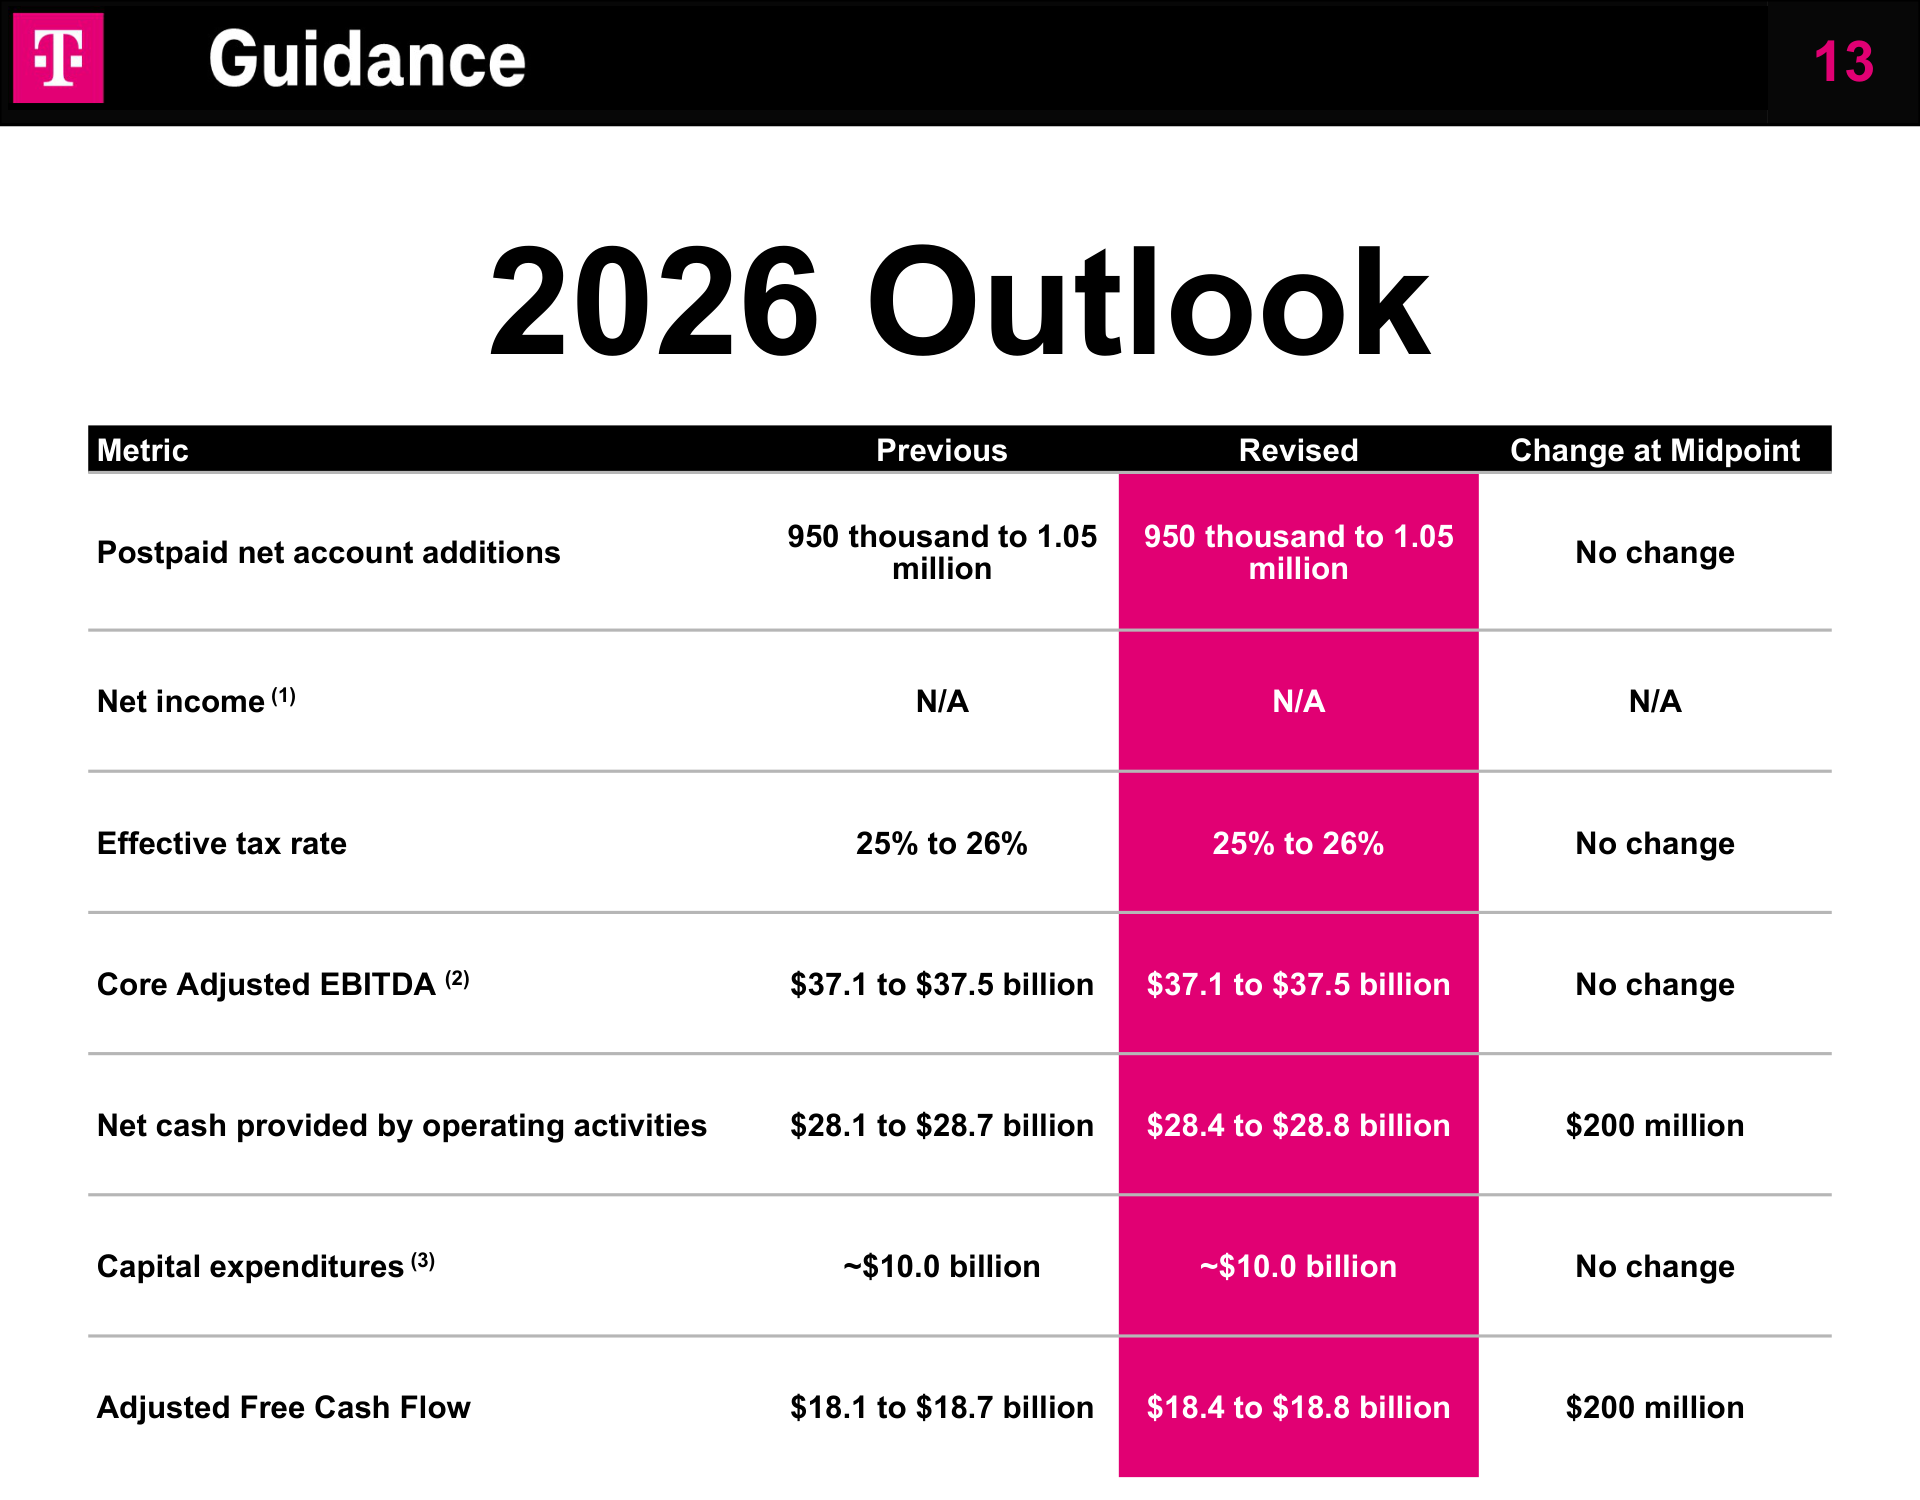
- The account guidance has its own history. The February release called for 900,000 to 1.0 million net account additions. The company raised that to 950,000 to 1.05 million with first-quarter results and left it there in July.
- Own calculation (factbook page 13 and the second-quarter call): Subtracting first-half additions of 494,000 and the third-quarter guide of about 250,000 from the full-year range leaves 206,000 to 306,000 for the fourth quarter. The fourth quarter of 2025 delivered 261,000.
- The midpoint of 1.0 million is -15.3% below the 1.18 million accounts added in 2025. Service revenue guidance of about $77.0 billion is +8.0% above 2025, and the 10-Q lists higher average postpaid accounts "including following the acquisitions of UScellular and Metronet" as the first reason postpaid revenue grew.
What the Investor Factbook Shows on Accounts and Returns
- Page 4 of the second-quarter factbook puts postpaid accounts and quarterly net additions on one chart. Accounts rose from 31.50 million to 34.70 million over the year, while the quarterly bars ranged from 217,000 to 396,000.
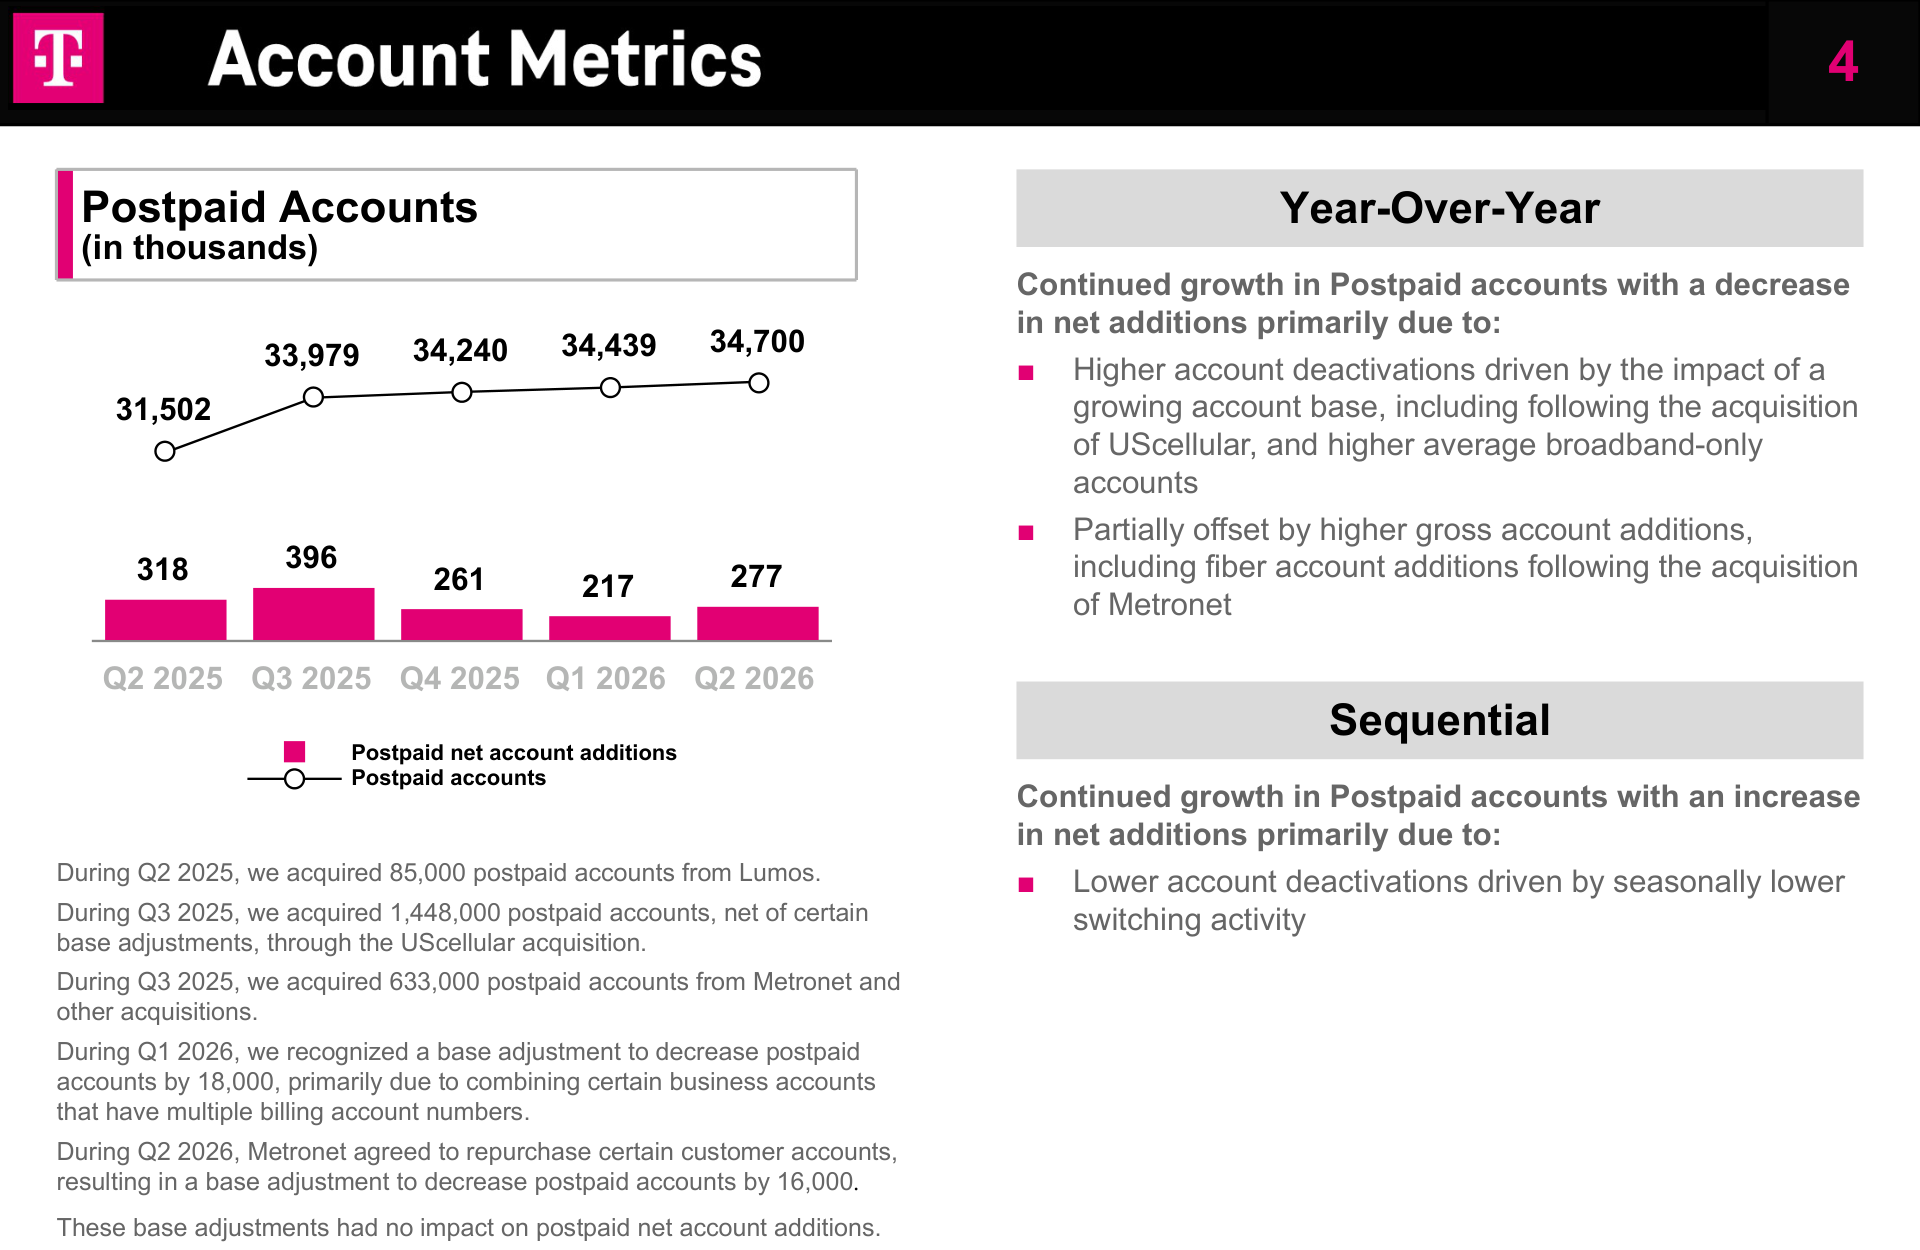
- The footnotes under the chart are the key to reading it. In the third quarter of 2025, 1,448,000 accounts arrived with UScellular and 633,000 with Metronet and other acquisitions. Base adjustments removed 18,000 accounts in the first quarter of 2026 and 16,000 in the second. The company notes that these adjustments had no impact on net additions.
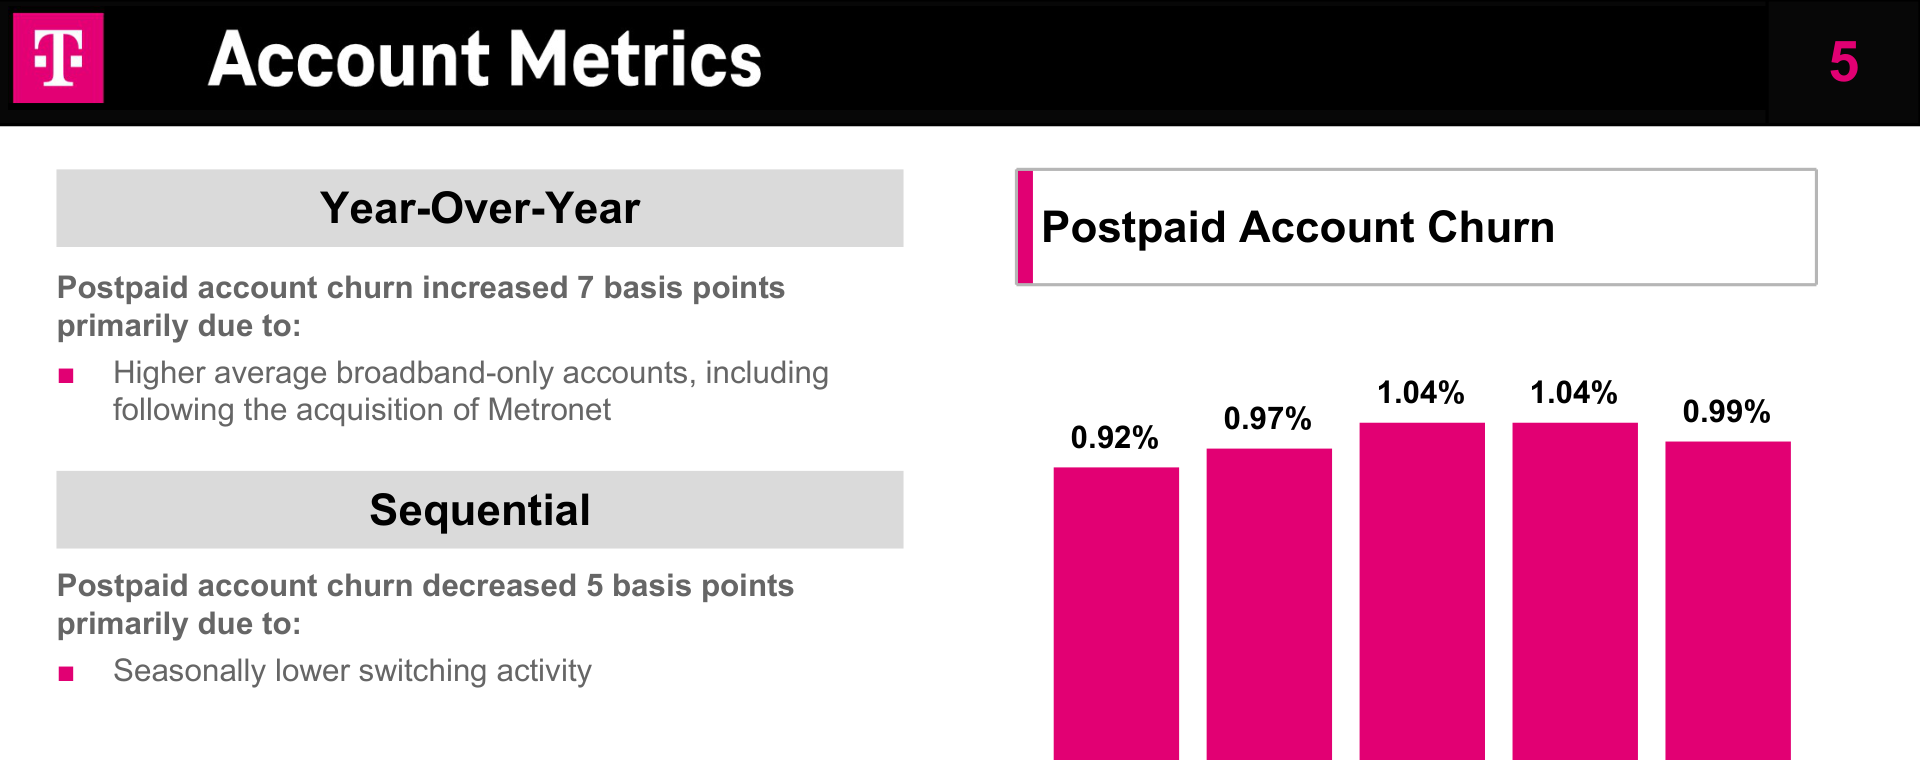
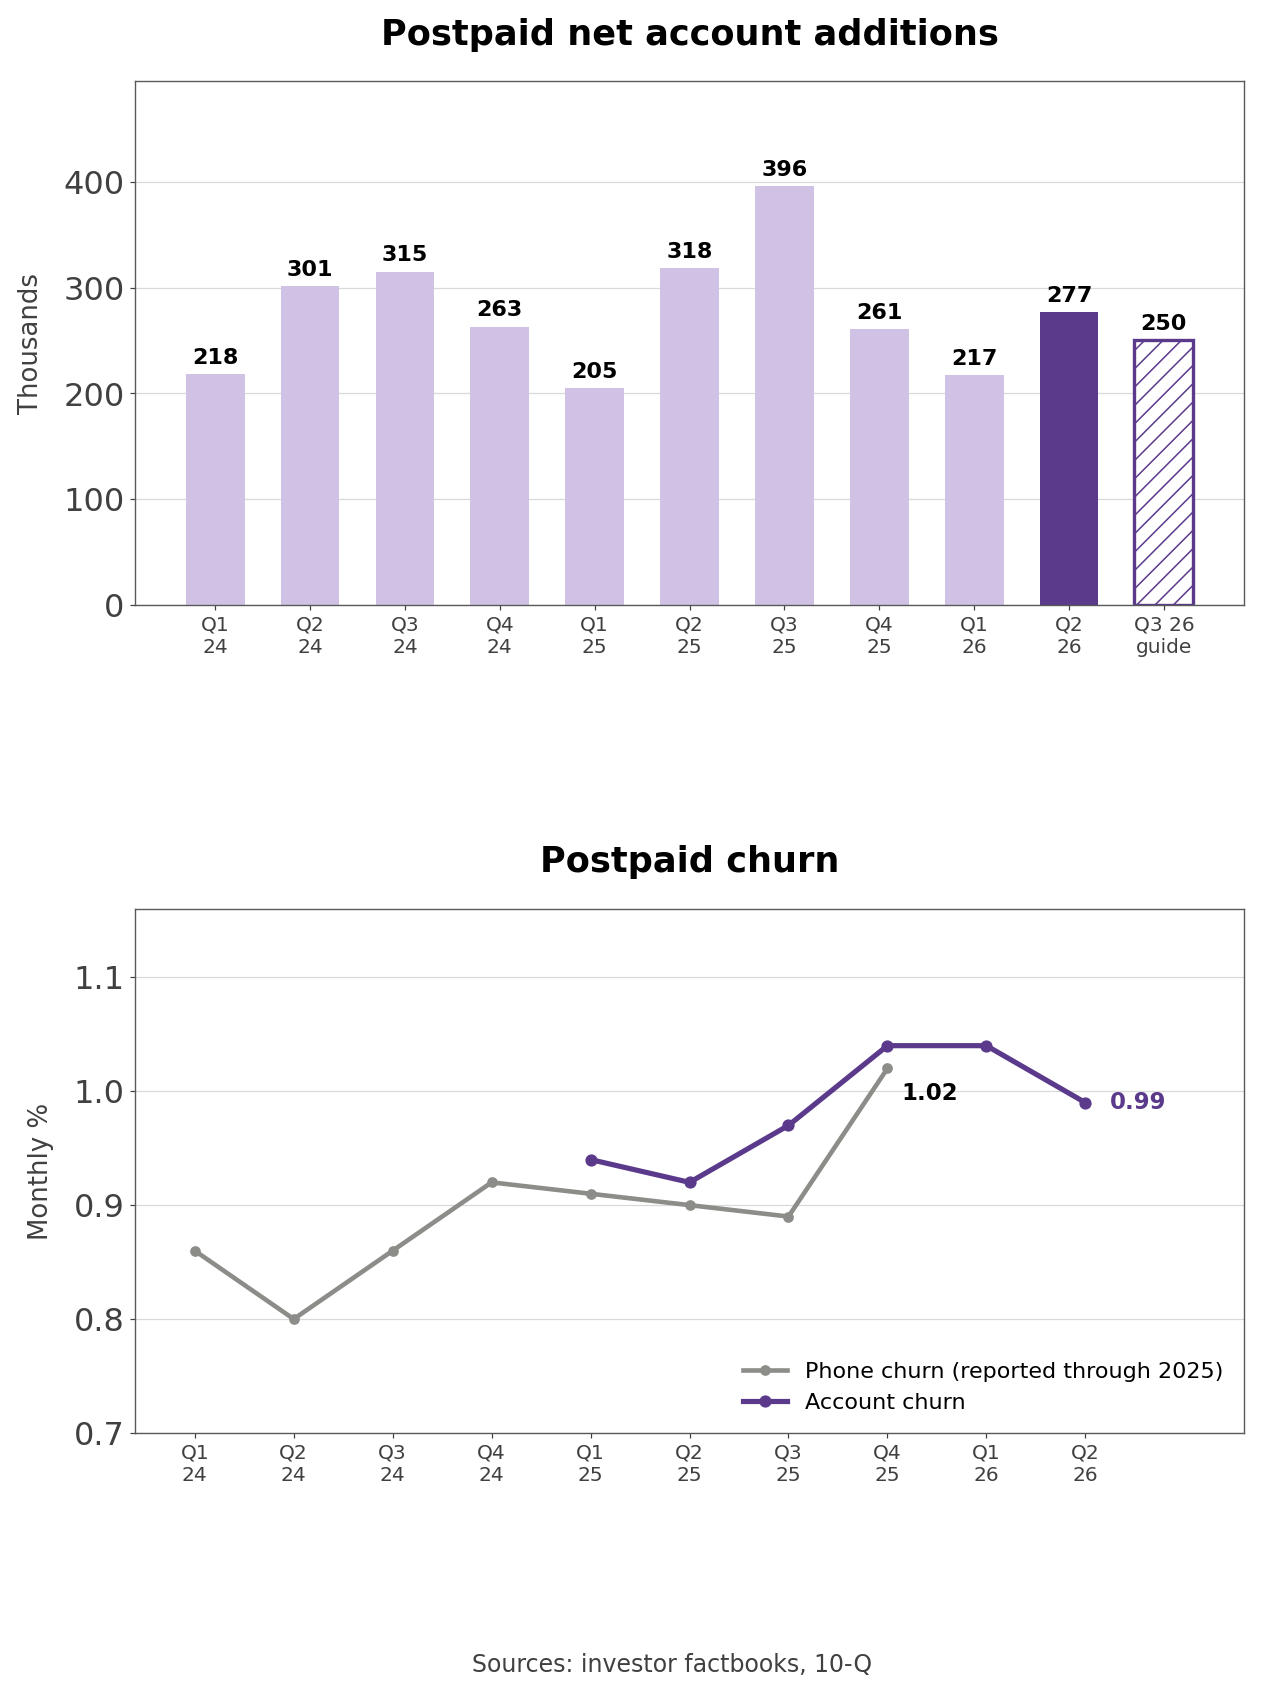
- Page 5 shows postpaid account churn rising from 0.92% in the second quarter of 2025 to 1.04% in the fourth quarter and the first quarter of 2026, before easing to 0.99%. The company attributes the year-over-year increase to more broadband-only accounts after the Metronet acquisition, and the sequential decline to seasonally lower switching.
- Page 12 covers capital structure and stockholder returns. Since the program began in the third quarter of 2022, T-Mobile has returned $54.6 billion through June 30, 2026: $44.2 billion for 250.8 million repurchased shares and $10.4 billion in dividends. The 2026 authorization started at $14.6 billion in December and was raised to $18.2 billion on April 23. The last line on the page notes another $392 million of repurchases in the third quarter through July 17.
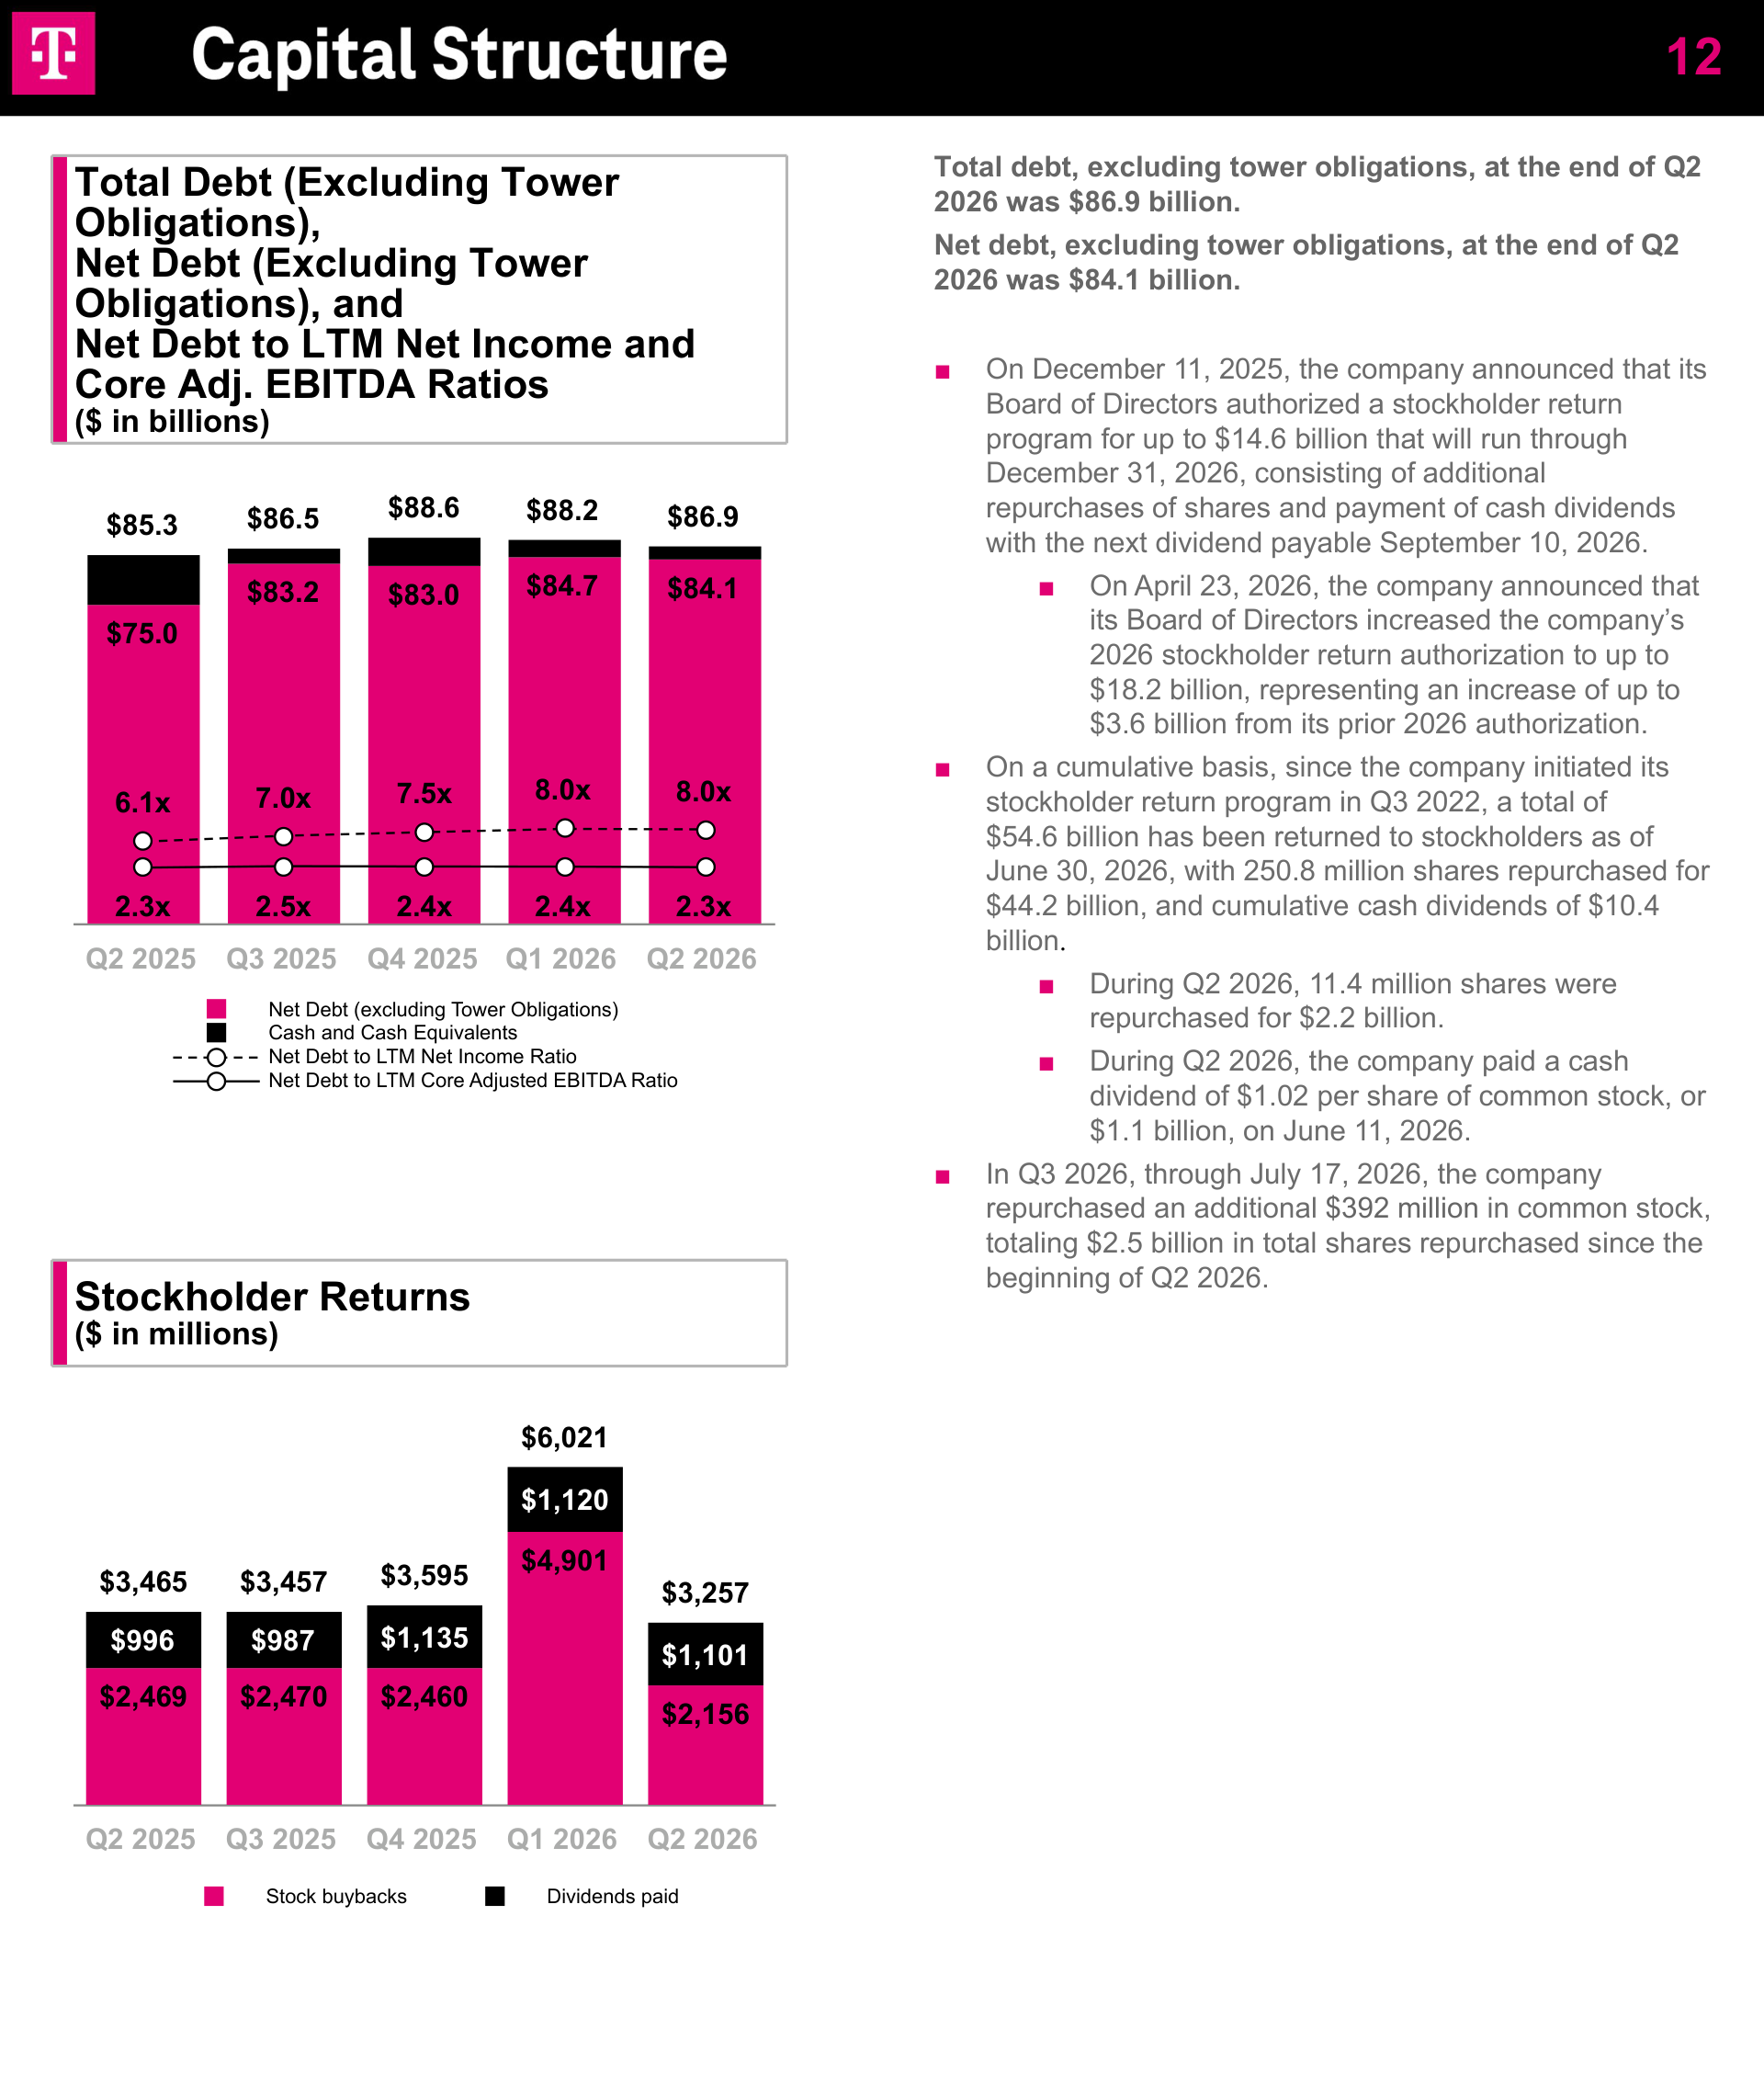
- The Q2 2026 10-Q cash flow statement fills in the half. Buybacks took $7.146 billion and dividends $2.221 billion. The company issued $6.393 billion of long-term debt and repaid $7.771 billion, and cash and cash equivalents fell from $5.598 billion to $2.825 billion.
- The same page shows net debt of $84.1 billion, 8.0 times trailing twelve-month net income against 6.1 times a year earlier. Against Core Adjusted EBITDA the ratio is 2.3 times, inside the company's 2.5 times leverage target. Page 10 reports Core Adjusted EBITDA at 50.2% of service revenues, up from 49.0%, so margins are widening while account additions shrink.
The Market Case for T-Mobile
- The market has paid a growth multiple for a telecom stock on a simple argument. T-Mobile wins network quality awards, takes customers from rivals, builds new revenue in 5G home internet and fiber, and returns the cash to shareholders.
- Part of that argument holds up in the filings. Postpaid service revenue grew +13% in the second quarter, Core Adjusted EBITDA +11.7%, and the company reported a record net promoter score of 46. Postpaid ARPA (average revenue per account) was $152.91, +2.0% from a year earlier.
- The other part is weakening. Account additions are falling, two thirds of the past year's account growth came through acquisitions, and the most familiar way to count customers is no longer published.
From the Sprint Merger to UScellular
- T-Mobile US started as the 2013 combination of T-Mobile USA, the American unit of Deutsche Telekom, with MetroPCS. Deutsche Telekom remains the largest stockholder and nominates directors under a stockholders' agreement.
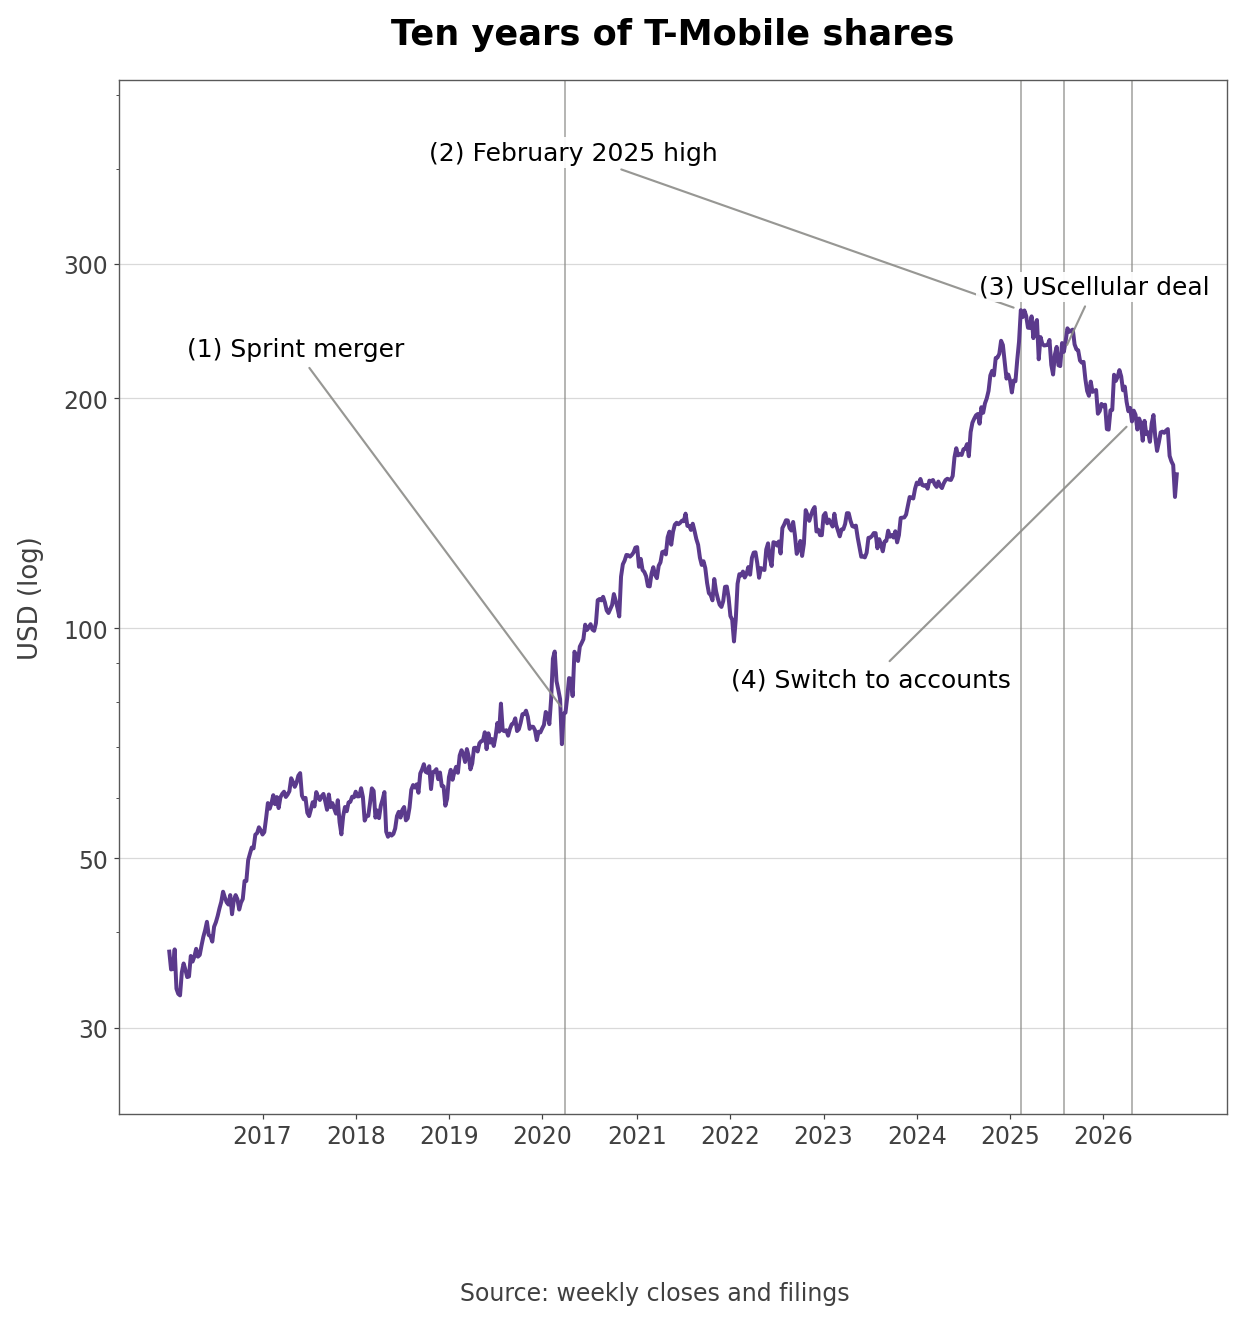
- The first marker is the April 1, 2020 close of the Sprint merger, which turned the third and fourth carriers into one and created today's three-player market. Merger costs and impairments weighed on net income, and the P/E reached 117 times at the end of 2022.
- The second marker is the February 2025 high. The third is the August 1, 2025 close of the UScellular wireless acquisition, for which T-Mobile paid $2.8 billion in cash and took over $1.7 billion of UScellular notes. A week earlier, on July 24, it invested $4.6 billion in a joint venture to buy fiber provider Metronet.
- The fourth marker is April 2026, the first results without phone metrics. Leadership changed along the way. Srini Gopalan succeeded Mike Sievert as CEO on November 1, 2025, and on September 3, 2026 the company said CFO Peter Osvaldik will retire in February 2027, to be succeeded by Jessica Uhl, a former Shell CFO.
- From a February 2016 low of $33.05, the shares rose 7.9 times to the high. They returned -8.5% in 2025 and -19.1% in 2026 to date.
Why Did T-Mobile Stop Reporting Phone Customers?
- The fourth-quarter 2025 investor factbook ran 30 pages, and the second-quarter 2026 factbook runs 26. The missing pages held postpaid phone net additions, phone churn, phone ARPU, and the counts of 5G broadband and fiber customers.
- Filing footnote (Q2 2026 10-Q, performance measures): "Beginning with the three months ended March 31, 2026, we shifted away from reporting customer performance measures to better align with the Company’s long-held priority on growing high-value accounts, which management believes is the best reflection of value creation versus customers."
- The last published numbers show when that choice came. Postpaid phone net additions were 3.294 million in 2025, more than 3.077 million in 2024, with quarterly figures of 495,000, 830,000, 1,007,000, and 962,000. Phone churn, though, climbed from 0.92% in the fourth quarter of 2024 to 1.02% in the fourth quarter of 2025, and from 0.86% to 0.93% for the full year. The 10-K blamed higher industry switching and the temporary impact of rate plan optimizations.
- Accounts and phones are different units. At the end of 2025 T-Mobile had 34.24 million postpaid accounts and 85.59 million postpaid phone customers, about 2.5 phones per account. In 2025 it added 1.18 million accounts and 3.29 million phones.
- T-Mobile's own fourth-quarter factbook noted that AT&T does not disclose postpaid net account additions and that Comcast and Charter do not disclose postpaid phone net additions. With T-Mobile now dropping phone additions as well, there is one less way to compare the three national carriers on the same basis.
How Much of Account Growth Came From Acquisitions
- Postpaid accounts rose from 31.50 million at the end of June 2025 to 34.70 million a year later, an increase of 3.198 million, or +10.2%.
- Own calculation (factbook account footnotes): Of the 3.198 million accounts added over the year, 2.081 million came through acquisitions, or 65.1%. Net additions over the four quarters totaled 1.151 million, 3.65% of the account base a year earlier.
- Quarterly additions are shrinking. The second quarter's 277,000 compares with 318,000 a year earlier, and the third-quarter guide of about 250,000 compares with 396,000, a -36.9% drop. The 10-Q attributes the second-quarter decline to higher deactivations from a larger account base after UScellular and more broadband-only accounts.
- Revenue follows the same pattern. Third-quarter service revenue guidance of about $19.3 billion is +5.8% year over year, below the second quarter's +8.9%. UScellular closed on August 1, 2025, so the acquisition starts dropping out of the year-over-year comparison in the third quarter.
Buybacks at an Average of $203 a Share
- In the first half of 2026 T-Mobile bought back 34.75 million shares for $7.057 billion. The first quarter alone took $4.901 billion, consistent with the February plan to roughly double first-quarter repurchases to as much as $5.0 billion.
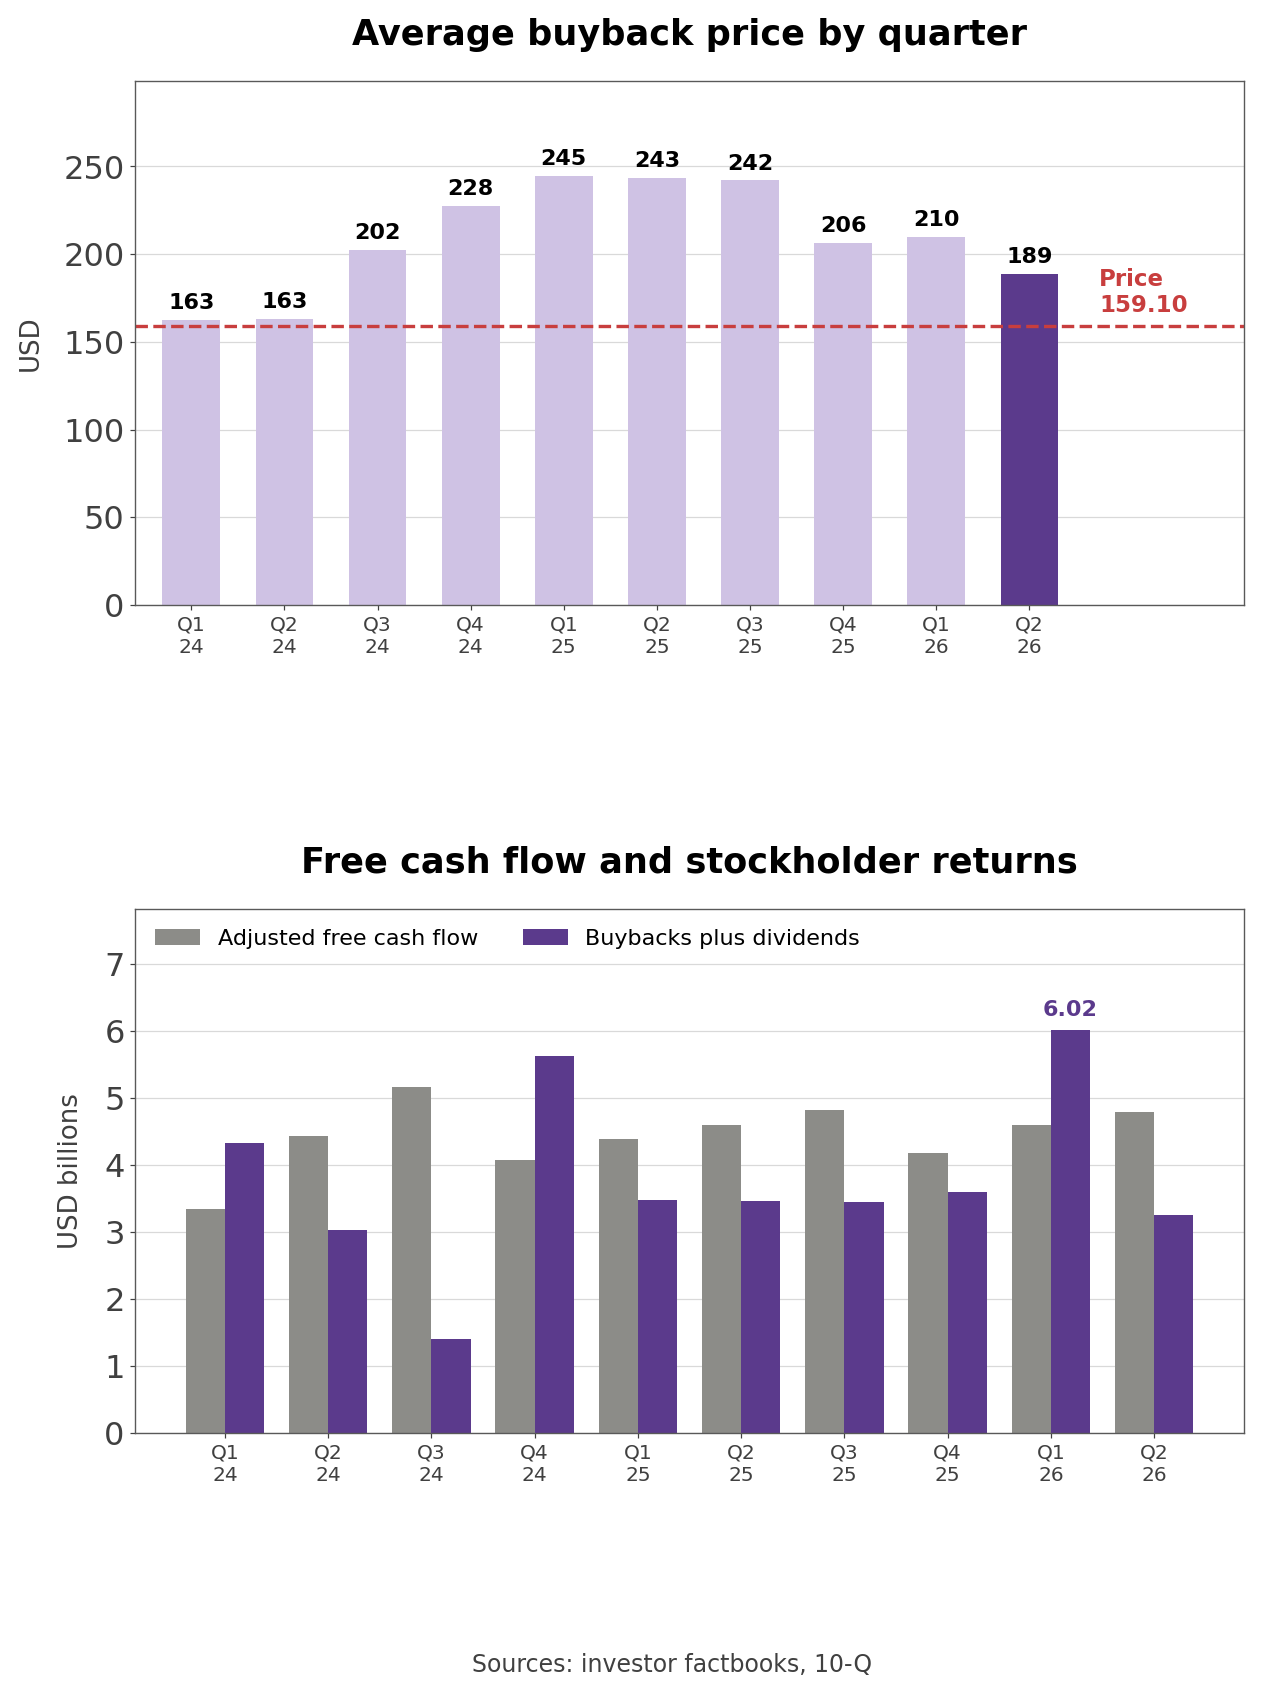
- Own calculation (factbook stockholder return table): The first-half average purchase price of $203.07 is above the $159.10 share price. Multiplying the gap by first-half shares gives $1.528 billion, and adding the 2025 purchases of 42.36 million shares at an average of $232.96 brings the total to $4.657 billion.
- Across the program since the third quarter of 2022, T-Mobile has bought 250.78 million shares at an average of $176.42, and the stock now sits -9.8% below that. The smaller share count lifts earnings per share. Second-quarter net income was $3.239 billion, roughly flat, while GAAP diluted EPS rose from $2.84 to $2.99, +5.3%.
- Returns are also taking a larger share of cash. Stockholder returns were 84.6% of Adjusted Free Cash Flow in 2024, 77.7% in 2025, and 98.7% in the first half of 2026. The company says more than $50 billion remains in its capital envelope through 2027, including up to about $30 billion for stockholder returns, and that it is keeping room for spectrum auctions in 2027 and 2028, including C-Band 2.0 and 2.7 GHz.
- On September 24 the quarterly dividend went from $1.02 to $1.17. The annual $4.68 is a 2.94% yield at the current price.
Rate Plan Modernization and Account Churn
- The company traced the low third-quarter account guide to rate plan modernization. On the second-quarter call, Osvaldik said the third-quarter modernization of legacy plans would temporarily raise account churn, and that the impact on phone churn would be smaller because it is concentrated in accounts with fewer lines.
- Moving customers off older, cheaper plans raises ARPA. The company guides 2026 postpaid ARPA growth to 2.5% to 3.0%, and first-half ARPA was $152.42, +2.9% above $148.06.
- The 10-Q lists three ARPA drivers. Fee revenue from new plans that bill taxes and fees separately and more lines per account from 5G broadband and business customers push it up, while fiber and UScellular accounts with fewer lines and bundled promotions push it down. The acquired accounts dilute ARPA, so as the acquisitions drop out of comparisons, the effect of the plan changes becomes easier to see.
- Pricing has a cost. Prepaid revenue fell -6% in the second quarter, which the 10-Q attributes to promotional dilution, and wholesale revenue fell -8% on lower MVNO revenue from DISH and TracFone.
- T-Mobile calls its approach "more-for-more." On the second-quarter call, Gopalan said more than 60% of new accounts chose premium plans and that port-in ARPA ran about 20% above port-out ARPA.
How T-Mobile Makes Money From Postpaid Accounts
- Second-quarter revenue of $22.79 billion included $18.98 billion of service revenue, and postpaid accounted for $15.85 billion, or 83.5%, of that. Prepaid contributed $2.47 billion and wholesale and other $657 million, while equipment revenue of $3.52 billion is booked separately.
- Depreciation weighs on the cost side. Network costs excluding depreciation and special items were $2.87 billion, 15.1% of service revenue, while depreciation and amortization rose to $3.43 billion from $3.15 billion. Accelerated depreciation tied to retiring the UScellular network is why Core Adjusted EBITDA rose +11.7% while net income was flat.
- A postpaid account bundles phones with 5G home internet gateways, fiber lines, tablets, smartwatches, and connected devices. Each added line raises ARPA, which is why the company focuses on families and small business accounts.
- At the end of 2025, the last period with customer counts, T-Mobile had 85.59 million postpaid phone customers, 30.85 million other postpaid devices, and 25.94 million prepaid customers, 142.39 million in total.
- Broadband comes in two forms. 5G home internet, which uses spare capacity on the wireless network, reached 8.45 million customers at the end of 2025, and the Metronet and Lumos deals brought fiber customers to 997,000. The 2030 goal combines the two at 18 million to 19 million.
- The network is the company's main selling point. The February release said T-Mobile placed first in network quality in five of six regions of the J.D. Power study for the first time, and that the share of switchers who view its network as the best rose from about one in eight in 2020 to more than one in four. It sizes the opportunity among network-focused households not yet with T-Mobile at more than 20 million.
- The brands are T-Mobile, Metro by T-Mobile in prepaid, and Mint Mobile, and T-Mobile for Business serves enterprise and government customers. On July 7 the company named Chris Sambar Chief Enterprise Officer and expects double-digit annual revenue growth for the business segment through 2027. Newer lines include the T-Ads advertising business and financial services, including a T-Mobile Visa card issued with Capital One.
How T-Mobile Compares With Three Telecom Peers
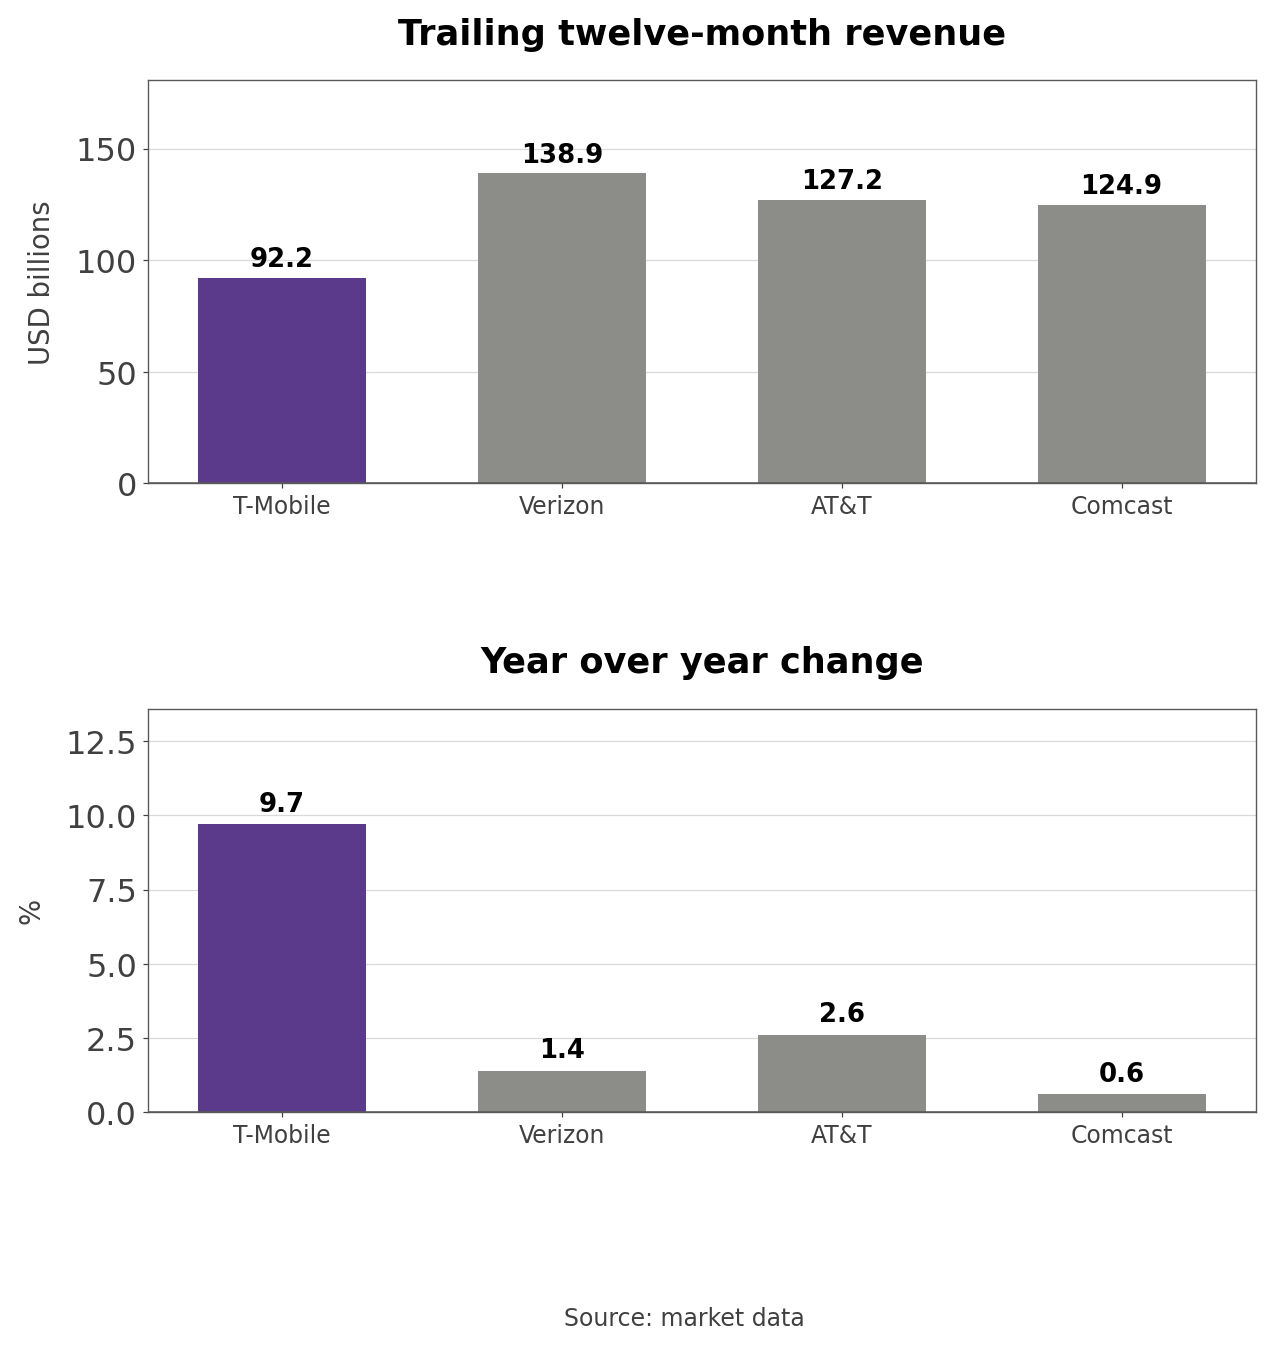
- From the same market data source, trailing twelve-month revenue is $92.19 billion at T-Mobile, $138.90 billion at Verizon, $127.24 billion at AT&T, and $124.90 billion at Comcast. T-Mobile's +9.7% growth is well above Verizon at +1.4%, AT&T at +2.6%, and Comcast at +0.6%.
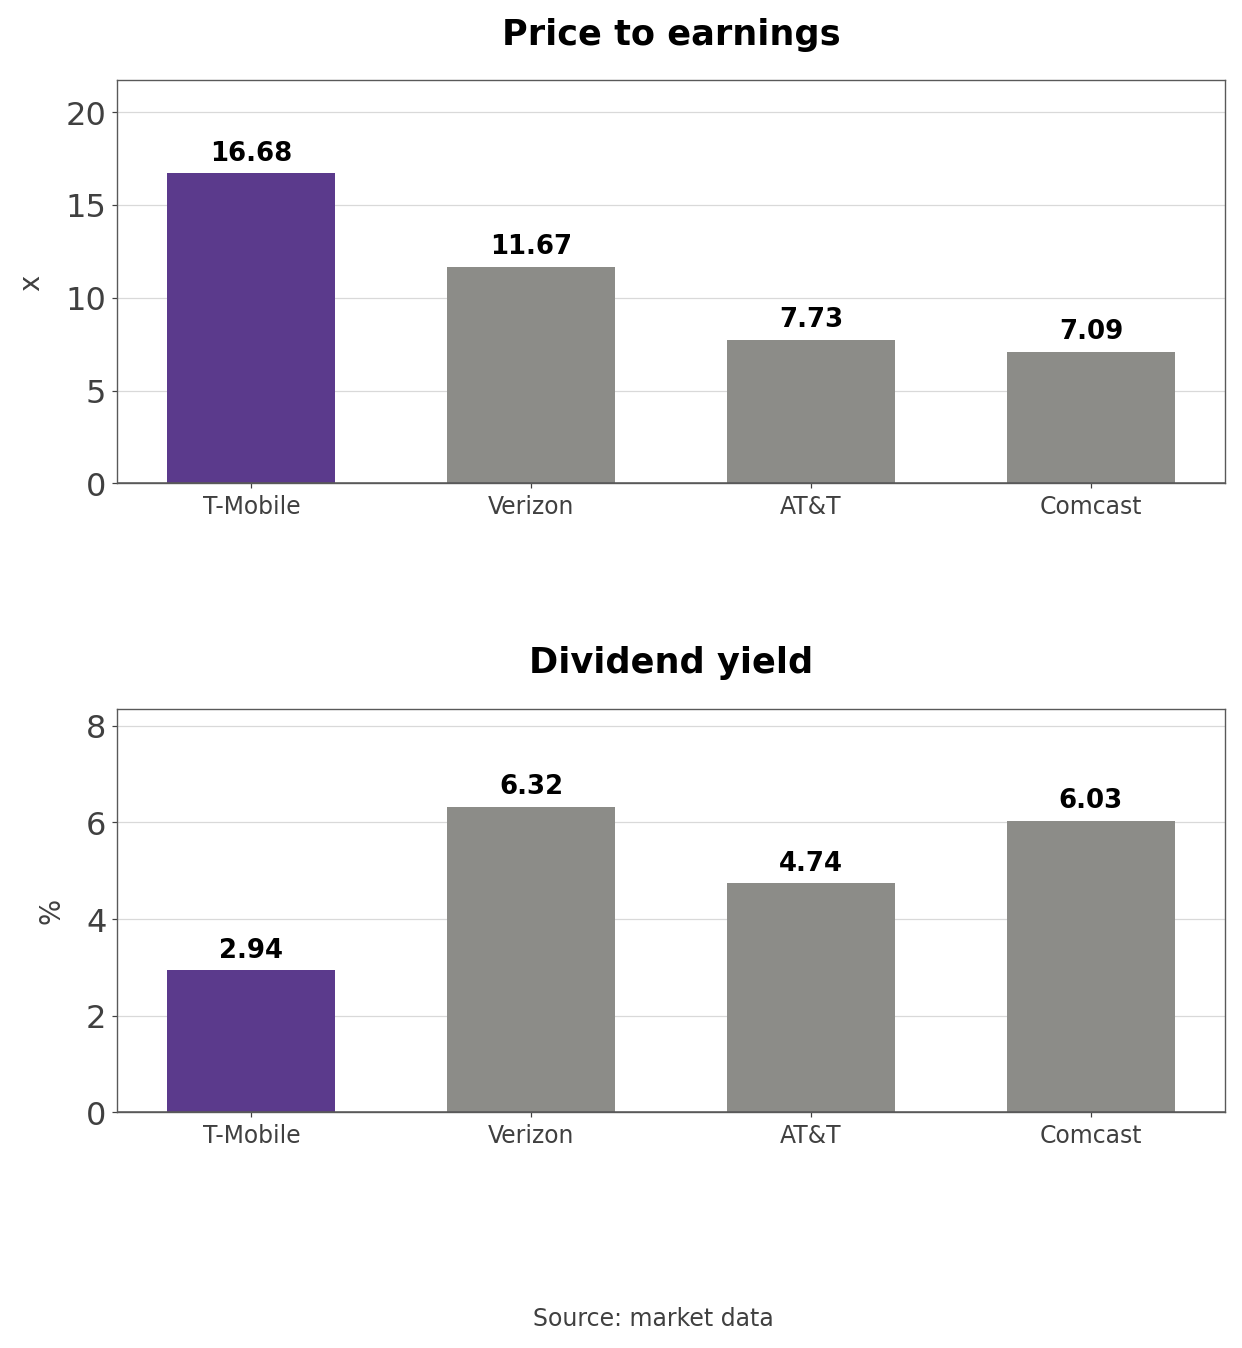
- P/E is 16.68x for T-Mobile, 11.67x for Verizon, 7.73x for AT&T, and 7.09x for Comcast. Dividend yields run the other way: T-Mobile 2.94%, Verizon 6.32%, Comcast 6.03%, and AT&T 4.74%.
- Dividing P/E by trailing revenue growth gives 1.7 for T-Mobile, 3.0 for AT&T, 8.3 for Verizon, and 11.8 for Comcast. T-Mobile's +9.7% includes the 2025 acquisitions, though. Using the third-quarter service revenue guide of +5.8% instead raises its figure to 2.9, still below Verizon and Comcast.
- One-year returns split the group. On month-end closes, T-Mobile is down -22.7%, Comcast -11.5%, and AT&T -0.8%, while Verizon is up +20.2%. The slowest grower gained the most, and the fastest grower fell the most.
TMUS P/E and P/S Bands Over 41 Months
- A P/E of 16.31x is the lowest of the 41 months since June 2023. The median over that window is 21.96x, and the high was 26.98x in February 2025.
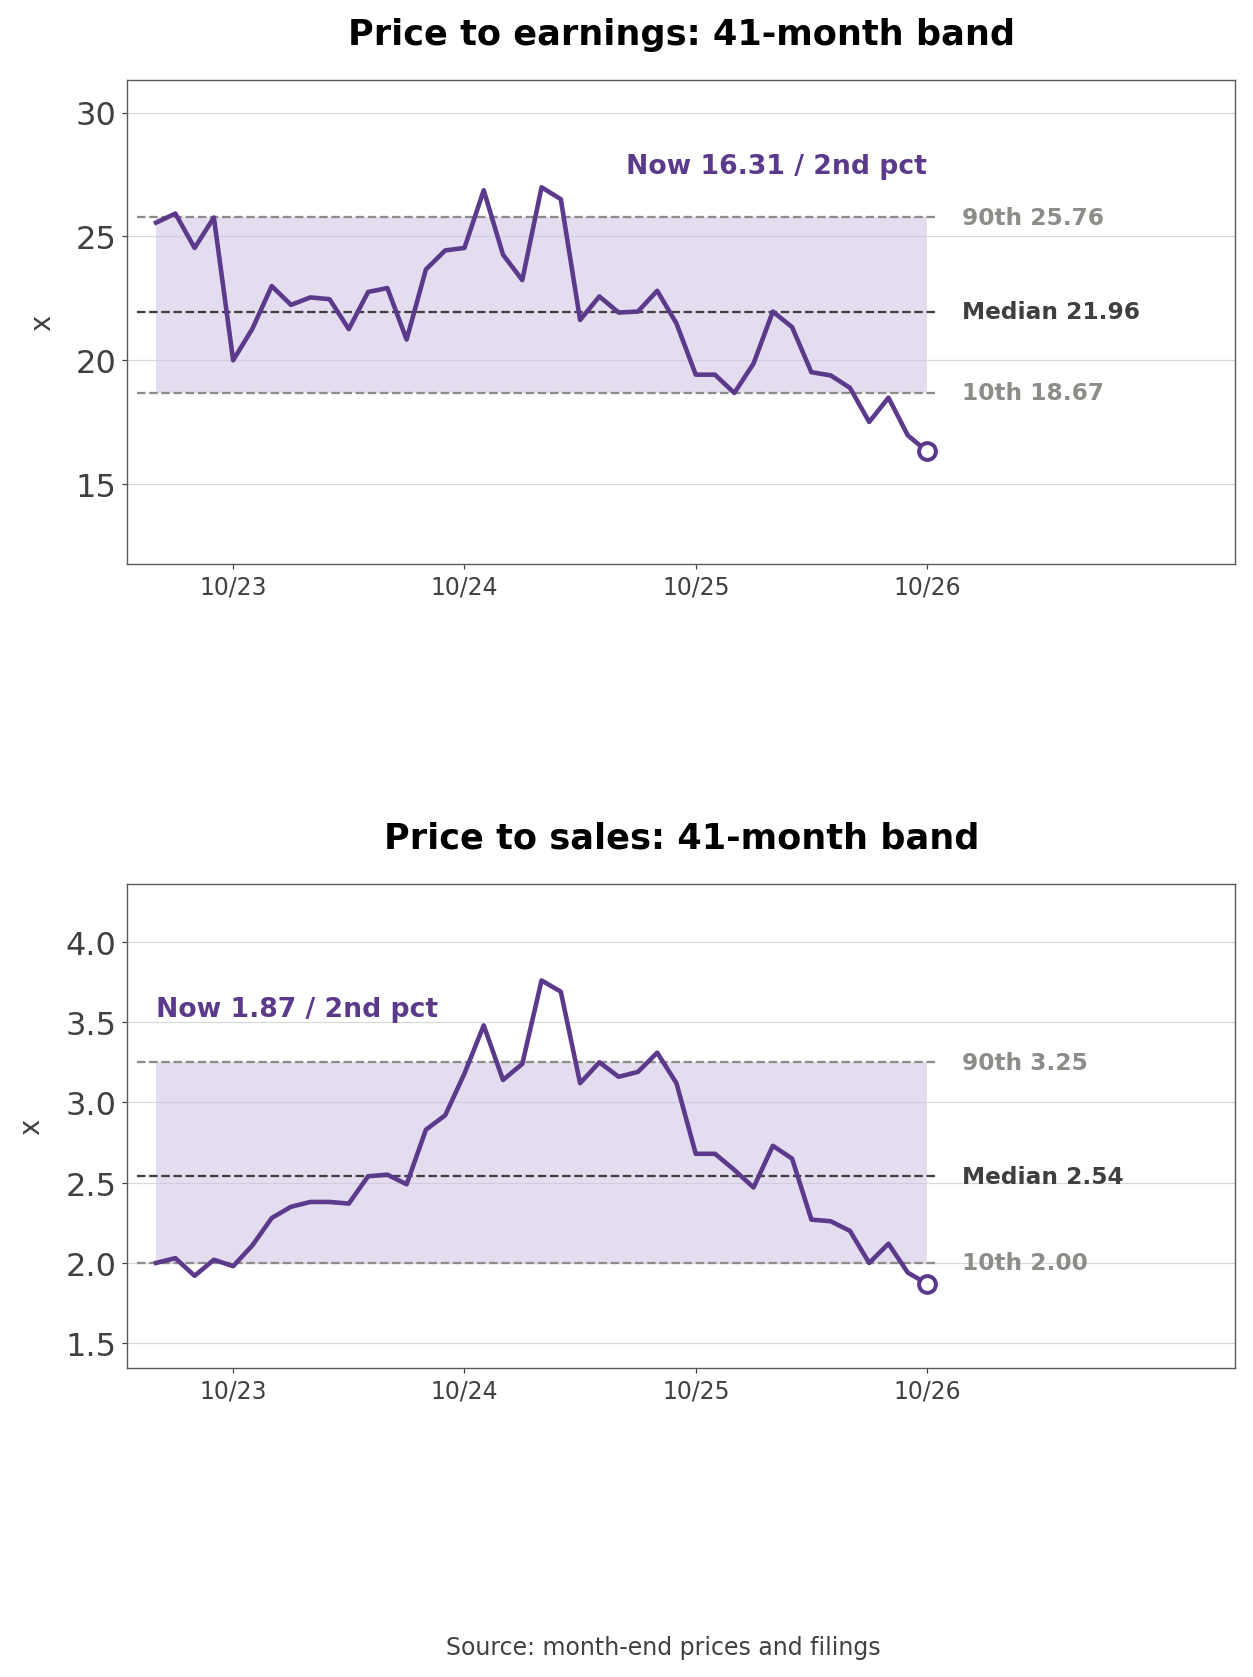
- The band starts in June 2023 because Sprint merger costs depressed earnings in 2022 and pushed P/E to 117x, which would turn the band into a picture of merger accounting. Price-to-sales of 1.87x is also the lowest of the 41 months, against a median of 2.54x.
- Own calculation (cover page share count): At $159.10 and 1.0727 billion shares outstanding on the July 17 cover page, market capitalization is $170.66 billion. Divided by trailing twelve-month net income of $10.56 billion, that is a P/E of 16.16x.
- The band's 16.31x uses quarterly diluted weighted shares and runs slightly higher, while the market data figure of 16.68x divides by trailing EPS of $9.55. On every definition the multiple is at the bottom of its 41-month range.
Three Conditions That Move the Stock
- Account additions come first. If the third quarter lands near 250,000 and the fourth quarter fills in 206,000 to 306,000, the full year stays inside guidance and the company's description of the churn spike as temporary holds up. If account churn stays above 1.04%, the price increases are costing customers.
- Cash and returns are second. Subtracting first-half Adjusted Free Cash Flow of $9.396 billion from the guide leaves $9.0 billion to $9.4 billion for the second half, and $8.92 billion remains under the $18.2 billion 2026 authorization. Using all of it would return nearly all second-half free cash flow, leaving the 2027 and 2028 spectrum auctions to be funded with debt.
- Competition is third. Over the past year Verizon's stock rose +20.2% while T-Mobile's fell -22.7%. The 10-Q cites higher industry switching among the reasons first-half additions declined. If rival promotions continue, holding both account growth and ARPA gets harder. If both rise together, a multiple at a 41-month low has room to recover.
What the Third-Quarter Report Should Show
- T-Mobile reports third-quarter results on October 28. The first numbers to check are whether account additions reached about 250,000 and how far account churn rose from 0.99%. Next come third-quarter buybacks, cash that fell to $2.825 billion at the end of June, and net debt of $84.1 billion.
- One question this piece cannot settle is how many phone customers T-Mobile actually added in 2026. Account additions cannot show whether existing accounts gained or lost lines, or whether churn came from phones or broadband-only accounts. If the third-quarter 10-Q again leaves out phone metrics, the only check will be the phone additions that rivals still publish.
Related Analysis
- ASML Stock Analysis: The Bookings Line That Went Missing: another company that stopped publishing a closely watched metric, useful for comparing how investors read the numbers that remain after a disclosure change.
- American Express (AXP) Stock Analysis: Credit Metrics Reset: a case where the yardstick behind key metrics changed, a useful frame for linking T-Mobile's customer series to its new account series.
#T-Mobile #TMUS #TMUSStock #TelecomStocks #Wireless #ShareBuybacks #USStocks #StockAnalysis #EquityResearch #GlobalStockBrief
'US Stock Analysis' 카테고리의 다른 글
| KLA (KLAC) Stock: Net Income Up 19% and Cash Flow Flat (0) | 2026.10.18 |
|---|---|
| Halozyme (HALO) Stock: 2033 Convertible Notes, Dilution (0) | 2026.09.21 |
| Illumina (ILMN) Stock Analysis: Organic Growth vs M&A (0) | 2026.09.20 |
| AutoZone (AZO) Stock Analysis: ROIC Down 11 Quarters (0) | 2026.09.17 |
| NVIDIA (NVDA) Stock Analysis: $105B Guarantee, Cash Flow (0) | 2026.09.17 |


