
- Lam Research (NASDAQ: LRCX) reported September-quarter revenue of $8.22 billion, +54.4% from a year earlier, and a non-GAAP operating margin above 40% for the first time. Management has raised its 2026 wafer fabrication equipment (WFE) outlook on every call this year, from a $135 billion range in January to the mid-$150 billion range in October, and put a first number on 2027: above $200 billion. Yet the December-quarter revenue guide of $8.6 billion is only +4.6% above the September quarter, after the July guide had implied +20.5% growth, and management said it would have been slightly higher without near-term supply chain constraints. What remains open is what sets the pace at which a $200 billion market turns into Lam revenue: demand, or cleanrooms and components.
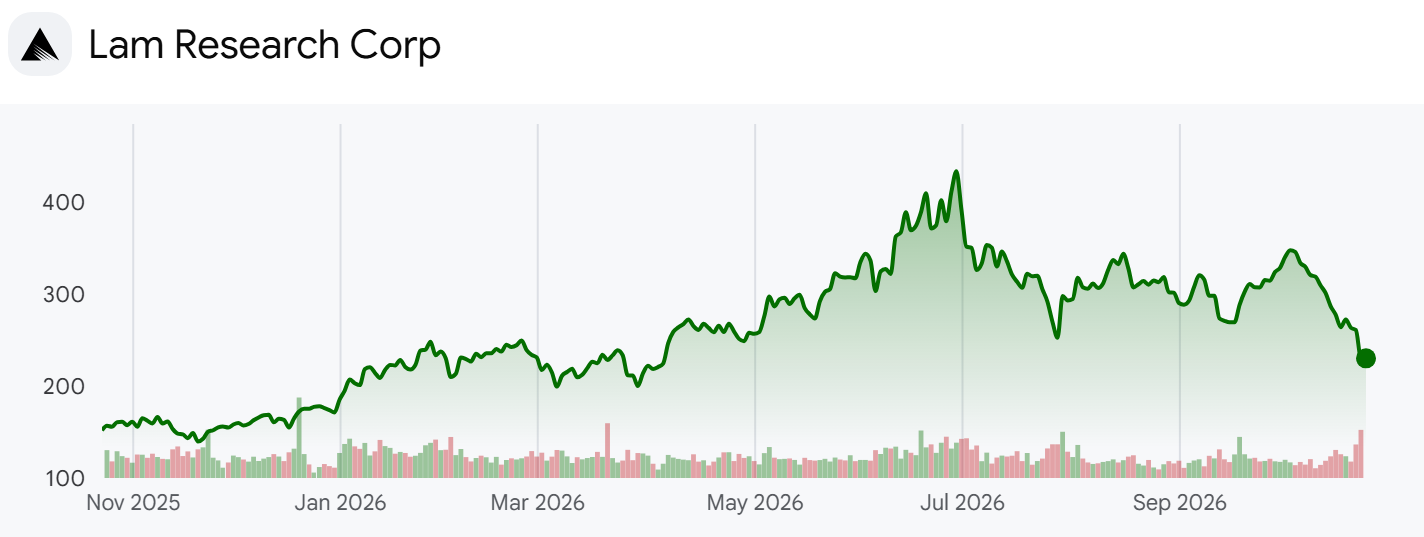
- Lam builds deposition tools that lay thin films on silicon wafers and etch tools that carve circuit patterns into them, and sells them to chipmakers such as Micron, Samsung Electronics, SK hynix and TSMC. At $230.10 a share the company is worth $287.4 billion. The stock is +34.4% in 2026 but -46.9% from its June month-end close of $433.33, and it fell -12.8% in the week of the results. The analysis parses 32 quarterly earnings releases since the fourth quarter of 2018 and checks them against the September-quarter earnings release, the 10-Q, the fiscal 2026 10-K, six investor decks from July 2025 to October 2026 and the call remarks. Lam's fiscal year ends in June, so the September quarter is its fiscal first quarter of 2027; this piece uses calendar quarters. Non-GAAP figures exclude items such as acquired intangible amortization, per-share figures before the October 2024 ten-for-one split are divided by ten, and the P/E band uses trailing twelve-month (TTM) non-GAAP diluted EPS of $6.76. On TTM GAAP EPS of $6.71 the P/E is 34.29.
Four Raises to the 2026 WFE Outlook
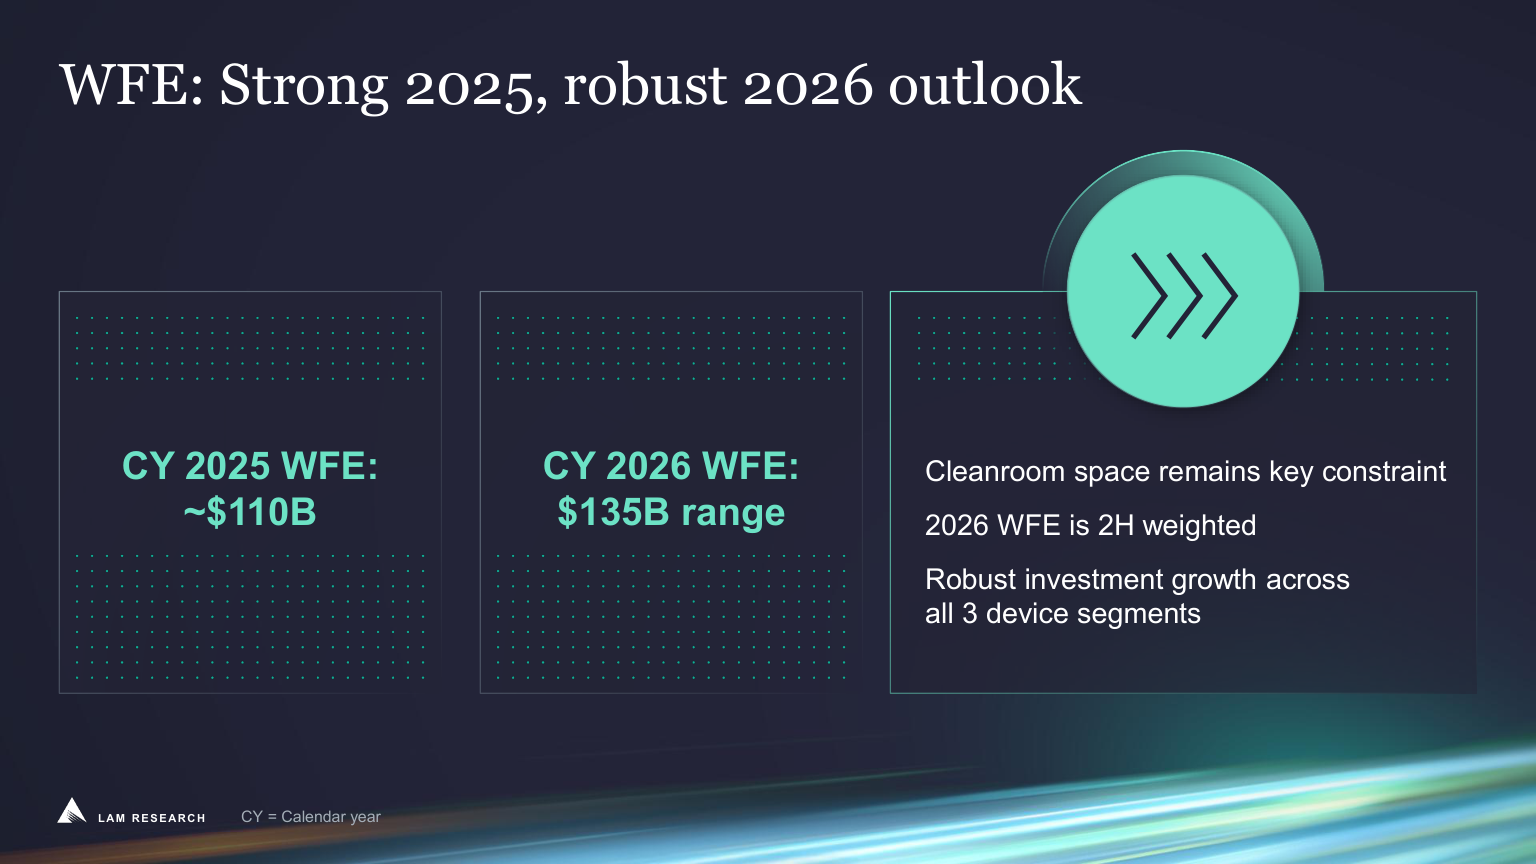
- Slide 8 of the January 2026 deck put 2025 WFE at about $110 billion and 2026 in a "$135B range," with the note that "Cleanroom space remains key constraint" and that 2026 spending would be weighted to the second half. The April deck raised the figure to "$140B with bias to upside," the July deck moved to "the low $150B range," and the October deck went to the mid-$150 billion range. The 2025 outlook followed the same path: the July 2025 deck lifted it to about $105 billion from about $100 billion, the October 2025 deck to slightly above $105 billion, and the year ended near $110 billion.
- The language about 2027 shifted each quarter as well. In April, Lam said the higher 2026 view "Sets stage for compelling 2027 WFE growth outlook." In July, under the heading "CY27+: Extraordinary set-up," the deck noted that "Customers have announced multi-year timelines for new fab projects" and highlighted a September guide of $8.1 billion, more than 20% above the June quarter. October was the first deck to attach a number to 2027.
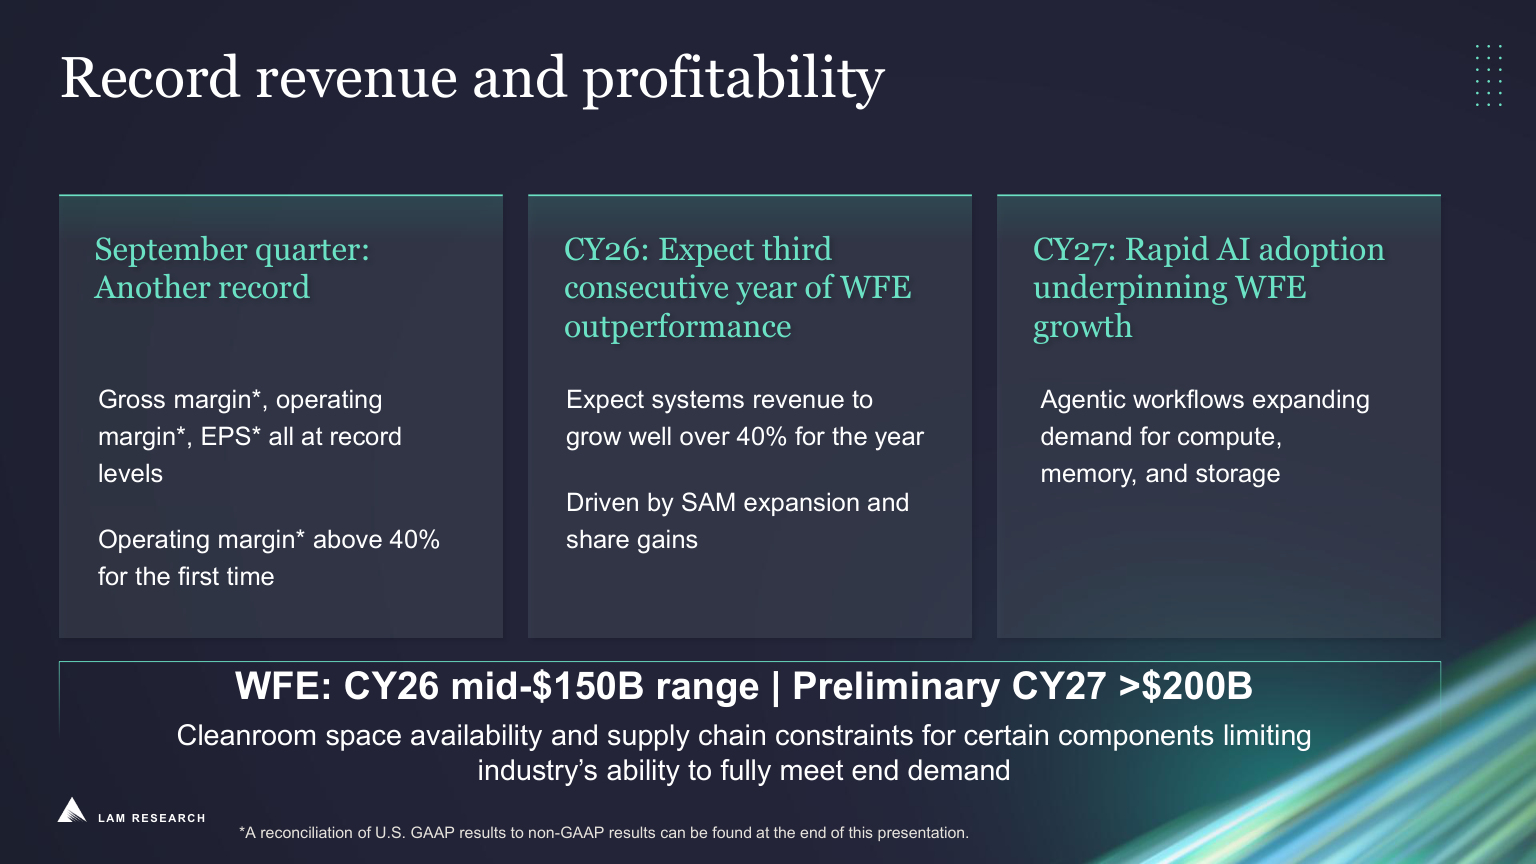
- Company disclosure (October deck and call): Slide 5 reads "WFE: CY26 mid-$150B range" and "Preliminary CY27 >$200B," followed by "Cleanroom space availability and supply chain constraints for certain components limiting industry's ability to fully meet end demand." Management expects DRAM to lead 2027 growth, followed by leading-edge foundry and logic and then NAND, and expects systems revenue to "grow well over 40% for the year" in 2026, the third straight year in which Lam outgrows WFE.
- On the call, CEO Tim Archer said customer visibility extends through 2028 but that it was early to give a precise WFE figure. The January call, when Lam normally gives detail, should bring a clearer view of cleanroom schedules and supply constraints. The $200 billion is a demand number; how fast tools get installed depends on cleanrooms and parts.
- Own calculation (share of WFE): Calendar 2025 revenue was $20.56 billion. Adding the December-quarter guide midpoint to the first three quarters gives $29.38 billion for 2026, up 42.9%. WFE moving from about $110 billion to the mid-$150s, taken as $155 billion, is a 40.9% rise, so revenue as a share of WFE edges up from 18.7% to 19.0%. The same ratio applied to $200 billion of 2027 WFE gives about $37.9 billion.
The December-Quarter Guide and Supply Constraints
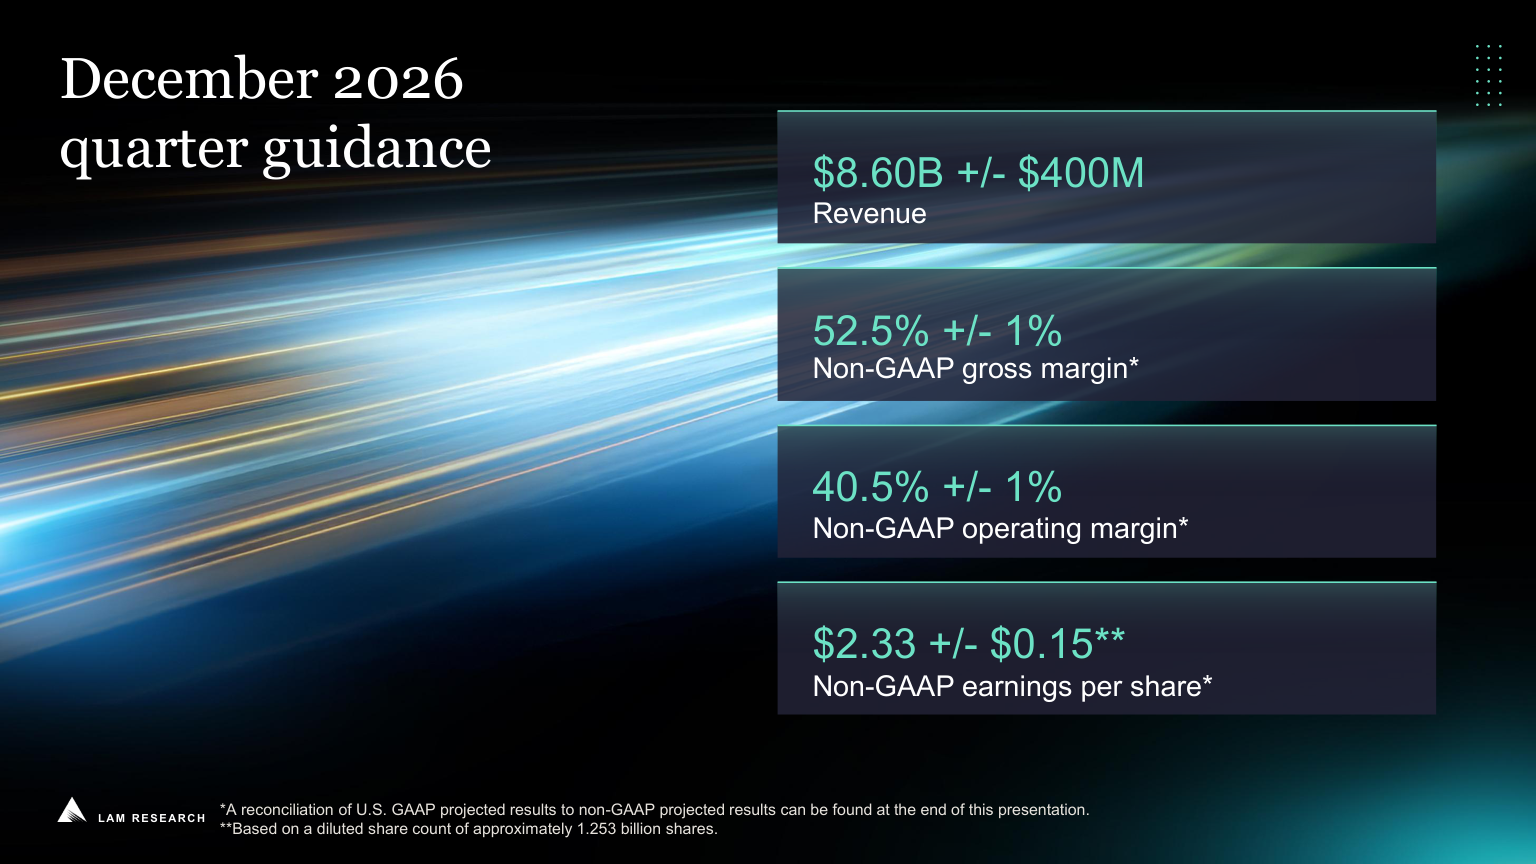
- Slide 17 sets the December-quarter guide at revenue of $8.60 billion plus or minus $400 million, a non-GAAP gross margin of 52.5% and an operating margin of 40.5%, each plus or minus one point, and EPS of $2.33 plus or minus $0.15 on about 1.253 billion diluted shares. The margins are slightly above September's 52.4% and 40.2%, but the revenue midpoint is only +4.6% higher and EPS +5.9%. The low end of the range, $8.2 billion, is -0.2% below September.
- Company disclosure (call remarks): The guide would have been slightly higher without the near-term supply chain constraints Lam is managing, and some shipments planned for December will go out in the March quarter. China will be a much lower share of December-quarter revenue than in September. The non-GAAP tax rate rose to 16.5% from 11% in the June quarter, is expected to stay in that range, and management asked analysts to update their models for it.
- The September quarter itself was unusual. Revenue rose +22.3% sequentially, the largest of 31 quarter-to-quarter changes since late 2018, and systems revenue rose from $4.25 billion to $5.73 billion, +34.9%, the largest since 2020 and well ahead of the next-best +20.2% in the third quarter of 2023. Deferred revenue grew from $2.43 billion to $2.66 billion. Lam also held about $468 million of shipments to Japanese customers not yet recognized as revenue, because title "does not transfer until customer acceptance."
- Slides 15 and 16 point the same way. Non-GAAP operating expenses rose from $916 million to $1,004 million, which management tied to incentive pay and growth programs such as Akara, Halo and Dextro. Inventory rose from $4.28 billion to $4.55 billion, yet inventory turns improved from 3.0 to 3.4, the highest in nearly seven years, and days sales outstanding fell from 72 to 63. Capital spending rose from $189 million to $258 million, and headcount grew by about 1,900, mostly factory and field staff for manufacturing expansion and tool installation.
- Own calculation (tax and guidance beats): At the June quarter's 11% tax rate, September-quarter non-GAAP EPS would have been about $2.345, or +6.6% above the reported $2.20. Reported EPS beat the July guide midpoint of $2.15 by 2.3%, against an average beat of 7.7% over the previous eight quarters.
The Bull and Bear Case for Lam Shares
- The bull case rests on a record of delivery and on the 2027 number. Revenue has beaten the guidance midpoint in 27 of the 30 quarters with guidance since early 2019, management raised its 2026 WFE view four times, and it now sees 2027 above $200 billion. CEO Tim Archer put the quarter down to execution: "With AI driving higher semiconductor demand and greater device complexity, our focus on operational execution helped Lam deliver record revenue, profit, and earnings per share in the September quarter." Free cash flow was $3.24 billion, 39.4% of revenue.
- The bear case rests on the next quarter and the multiple. The December guide slows to +4.6%, the tax rate is higher and China's share will fall. The P/E of 34.04 on TTM non-GAAP EPS is in the 82nd percentile of 83 months; it has more than halved from 74.46 at the end of June but remains above the 22.82 median.
From a 48% China Mix to an AI Memory Cycle
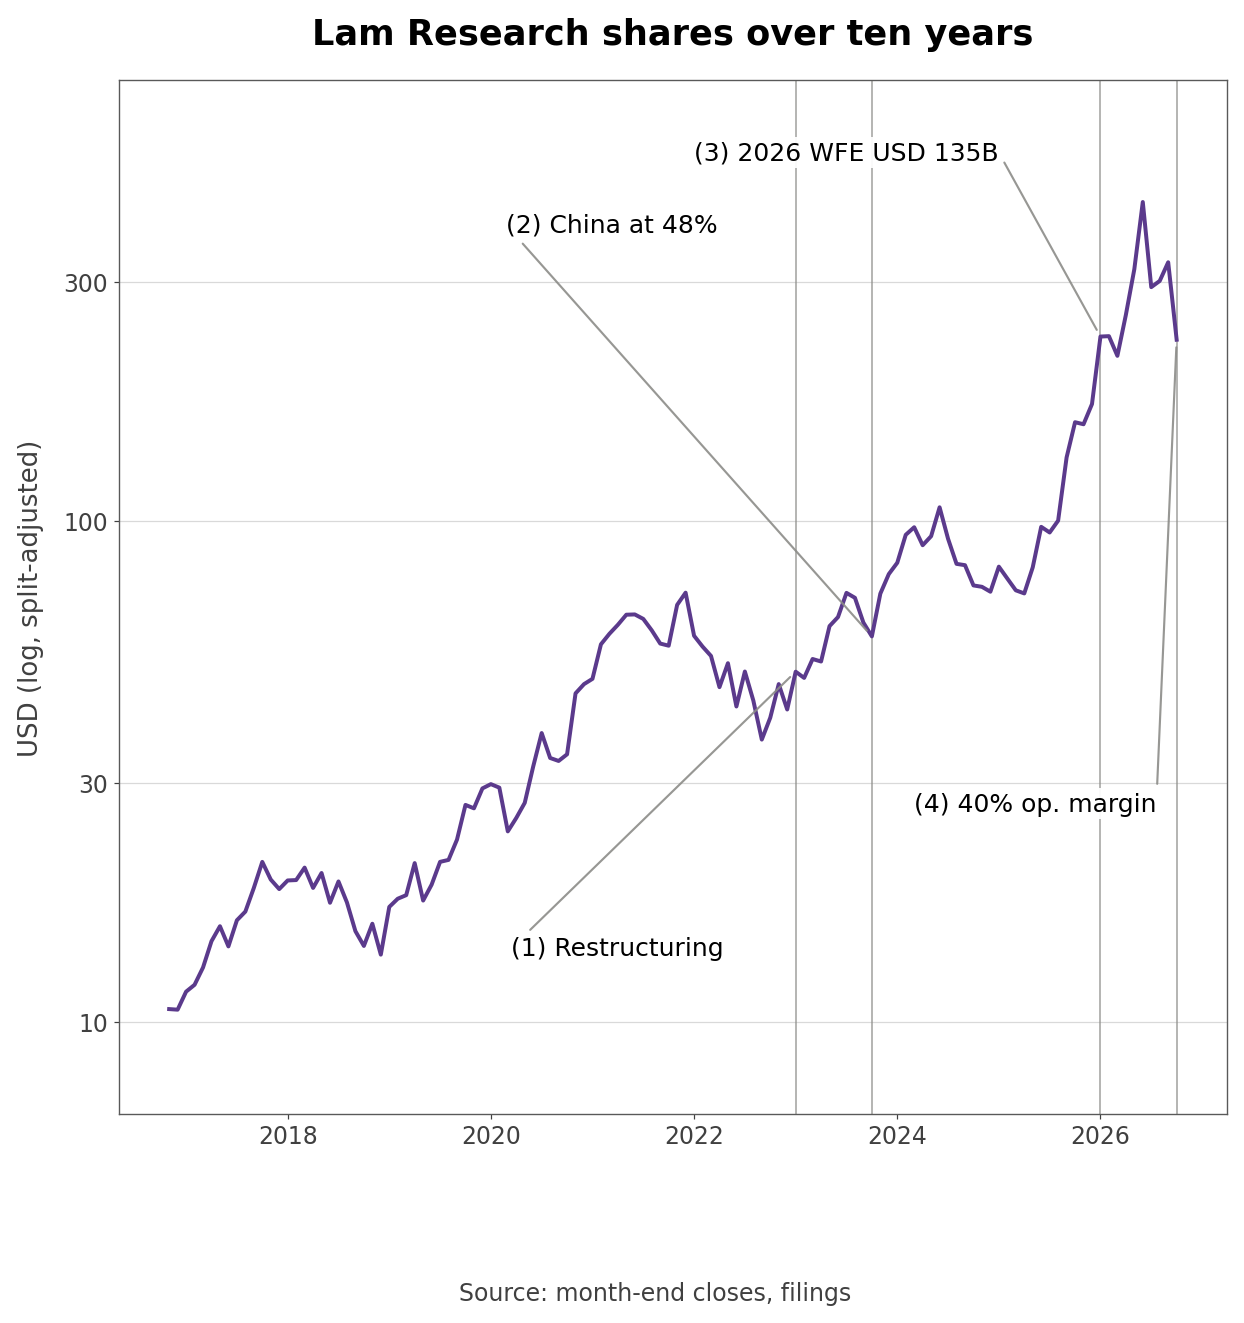
- The past four years reshaped Lam's customer map twice. Quarterly revenue fell from $5.28 billion in the fourth quarter of 2022 to $3.21 billion in the second quarter of 2023, -39.2%. According to the 10-K, Lam began a restructuring in fiscal 2023 and had terminated about 1,760 employees by June 2024.
- China filled the gap. Its share of revenue was 14% in the fourth quarter of 2018 and peaked at 48% in the third quarter of 2023, staying in the 40s through the first quarter of 2024. As Taiwan's share grew to 27% in the second quarter of 2026, China's fell to 26%, before rebounding to 35% in the third. The ten-for-one stock split took effect in October 2024.
- From 2025, memory investment for AI servers drove growth. September-quarter memory systems revenue rose about 120% from a year earlier, and quarterly revenue of $8.22 billion is 2.56 times the 2023 trough. On a year-end basis the stock moved -41.6% in 2022, +86.4% in 2023, -7.8% in 2024 and +137.0% in 2025.
How Fast Can Systems Revenue Keep Growing?
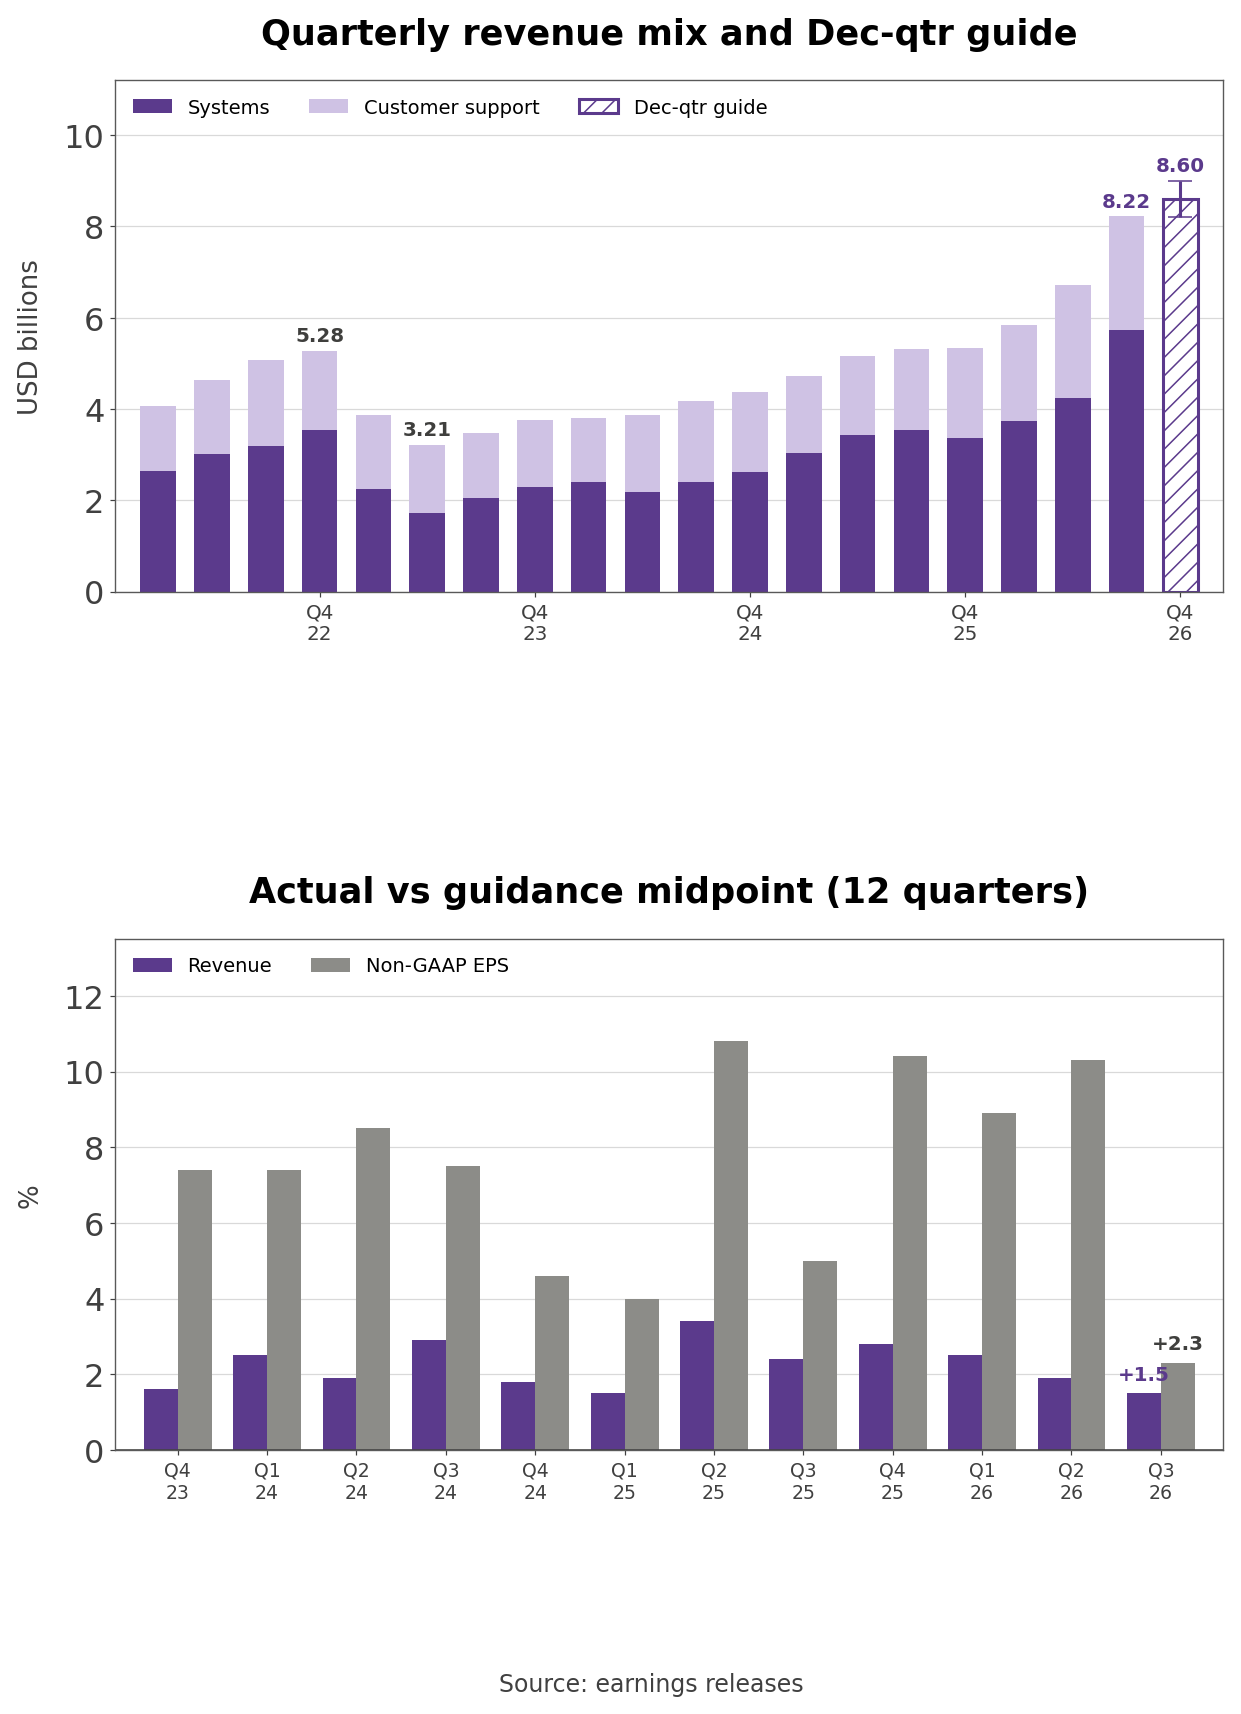
- The release describes systems revenue as "sales of new leading-edge equipment in deposition, etch, clean, and other wafer fabrication markets." Customer support (CSBG) revenue covers services, spares, upgrades and non-leading-edge Reliant tools. September-quarter systems revenue was $5.73 billion, +61.6% year over year, and CSBG was $2.49 billion, +40.0%. CSBG was nearly flat sequentially at +0.6% and fell to 30.3% of revenue.
- Systems revenue of $13.71 billion in the first three quarters of 2026 already exceeds the $13.38 billion recorded for all of 2025.
- Own calculation (2026 targets): Multiplying 2025 systems revenue by 1.4 and subtracting the first three quarters shows that December-quarter systems revenue of $5.02 billion would deliver 40% growth for the year, -12.5% below the September quarter. CSBG needs $2.27 billion in the December quarter for 30% annual growth, against $2.49 billion in September.
- The margin over guidance is narrowing. Of the 30 quarters with guidance since early 2019, revenue missed the midpoint only in the first quarter of 2020 (-10.6%), the fourth quarter of 2021 (-3.9%) and the first quarter of 2022 (-4.5%). Over the previous eight quarters the average beat was 2.4% on revenue and 7.7% on non-GAAP EPS. September's 1.5% revenue beat tied the low of that stretch, and the 2.3% EPS beat was the smallest since the first quarter of 2022.
WFE Raises and a Sector-Wide Sell-Off
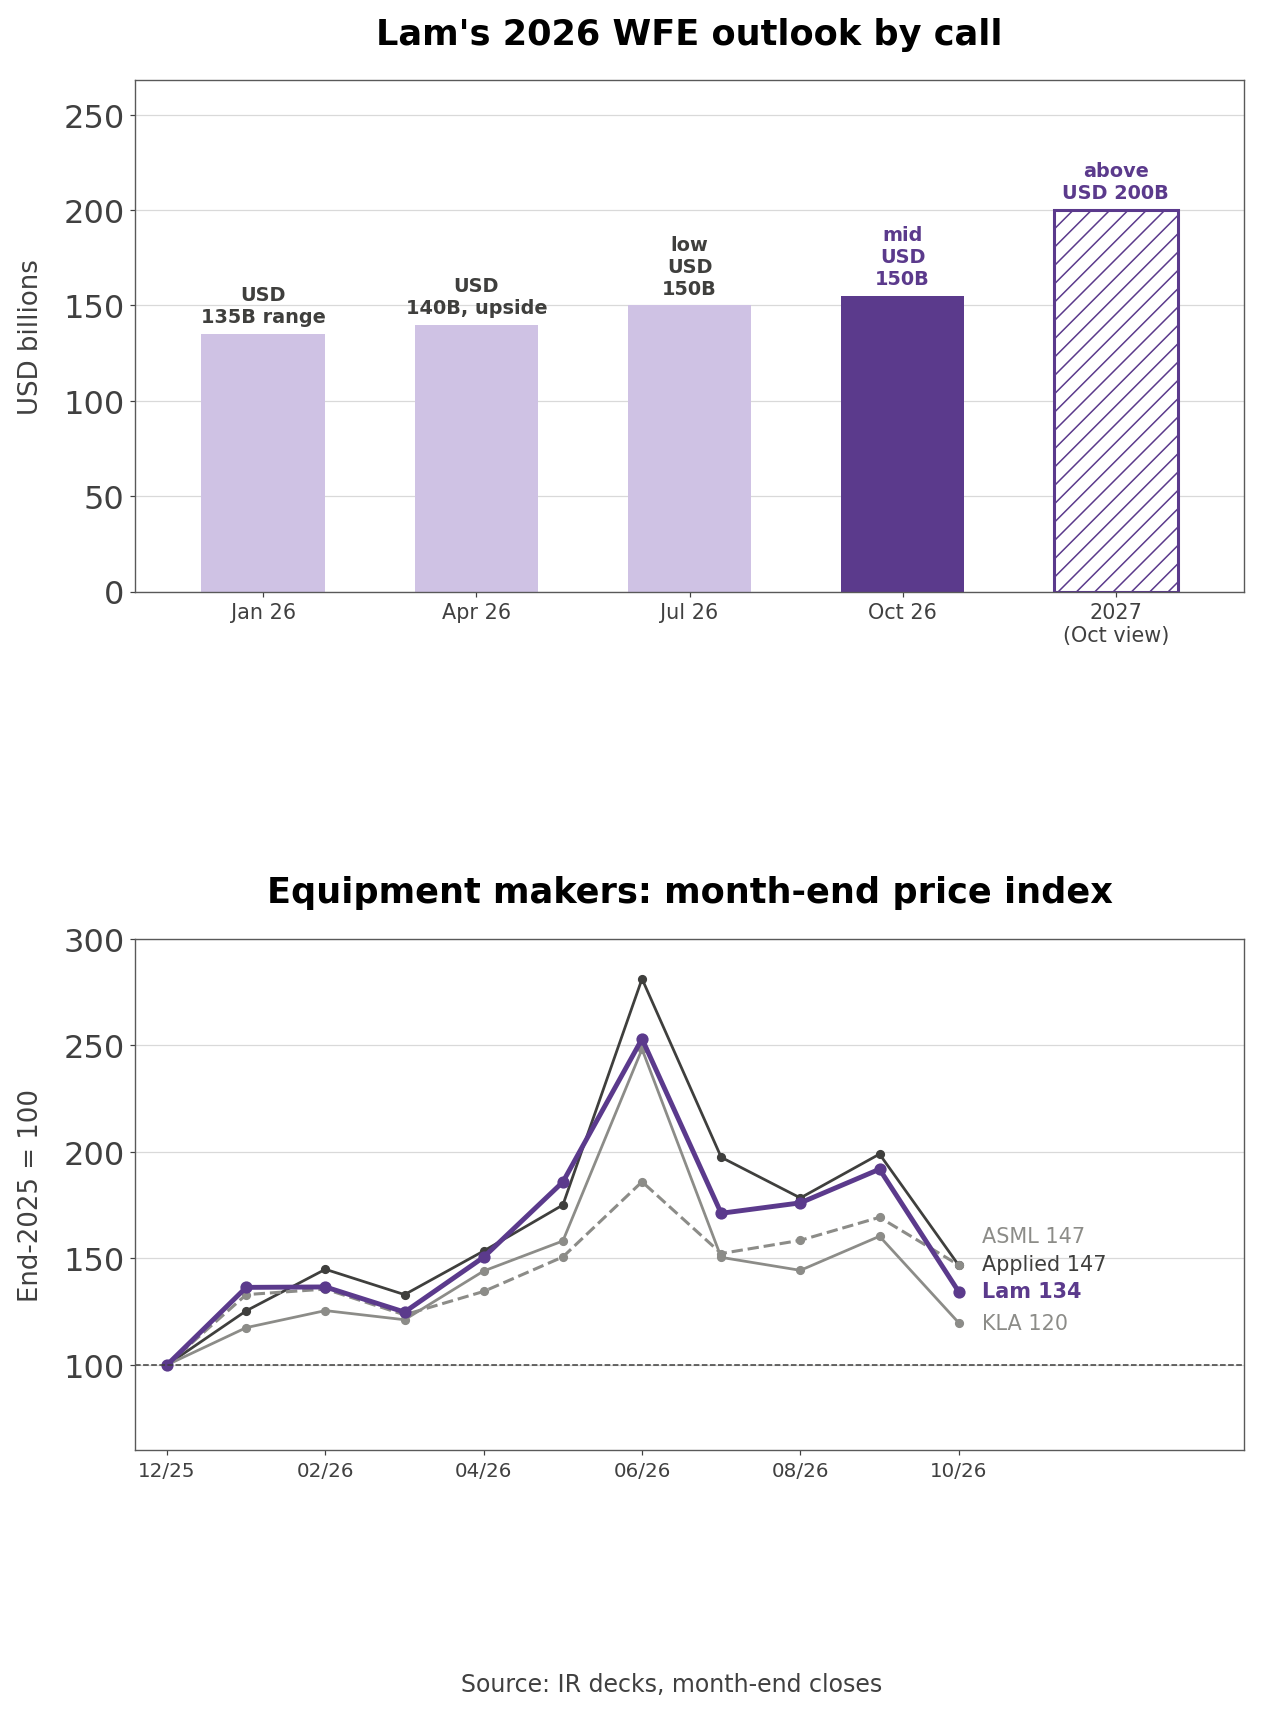
- Lam's outlook and its stock parted ways in July. The company lifted its 2026 view to the low $150s at July results, yet the stock fell -32.38% that month; in October, when it added the 2027 figure, it fell -29.96%. In June the shares had risen +36.29% to the highest month-end close of 2026.
- The decline was industry-wide. From the end of June, Applied Materials fell -47.8% and KLA -51.7%, close to Lam, while ASML, which sells lithography tools, fell -21.0%. Applied had risen +60.6% and KLA +57.0% in June, so much of the decline reversed June's spike. Indexed to the end of 2025, Lam stands at 134, Applied and ASML at 147 and KLA at 120.
- Outside view (consensus estimates, market data): The average non-GAAP EPS estimate for fiscal 2027, ending June 2027, is $9.63, up 17.2% from $8.22 ninety days earlier, and the fiscal 2028 estimate rose 19.6% to $12.15 from $10.16. At $230.10 the shares trade at 23.89 times the fiscal 2027 estimate and 18.94 times fiscal 2028.
- Estimates rose while the stock fell, so the multiple compressed. Fiscal 2026 non-GAAP EPS was $5.82, so the fiscal 2027 estimate implies growth of 65.5%.
How Lam Research Makes Money
- Lam has built wafer fabrication equipment since 1980. Fiscal 2026 revenue was $23.2 billion and R&D spending $2.4 billion, and headcount reached about 24,300 at the end of September, up from about 22,400 in June. Its 14 primary locations include Fremont and Livermore in California, Hwaseong, Osan and Yongin in South Korea, Hsinchu and Taoyuan in Taiwan, and Batu Kawan in Malaysia.
- The core of the business is deposition and etch. Deposition lays thin films on a wafer one layer at a time; etch removes material to form the circuit pattern. 3D NAND, which stacks hundreds of layers and drills deep holes through them, leans heavily on both steps, and Lam describes itself as having the "industry's largest NAND installed base." The 10-K names Micron, Samsung Electronics, SK hynix and TSMC as major customers, and non-U.S. sales were about 93% of revenue in each of the last three fiscal years.
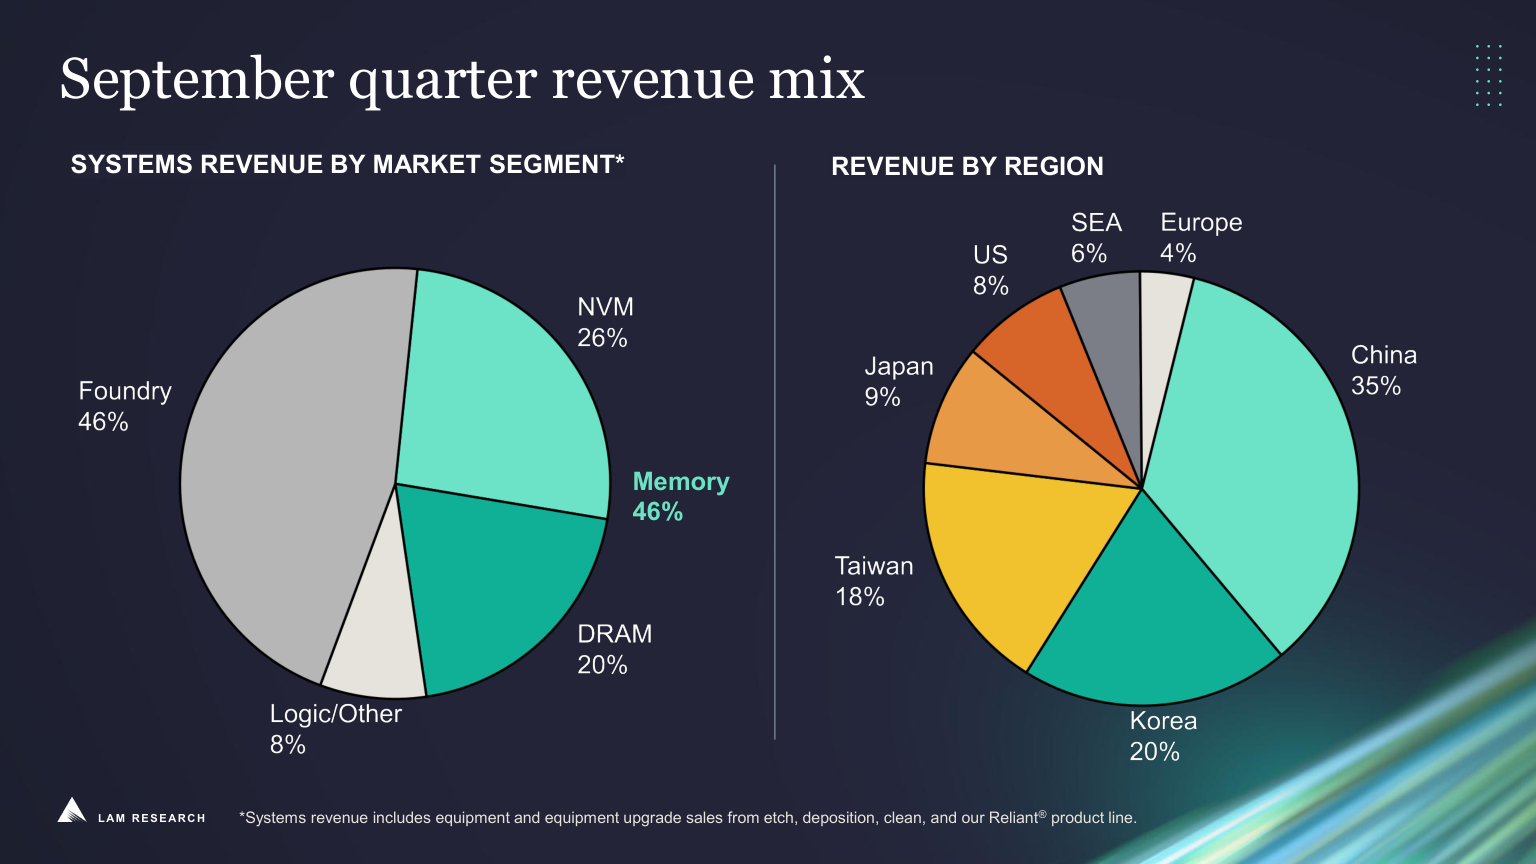
- Slide 13 shows September-quarter systems revenue split 46% foundry, 46% memory (26% non-volatile memory and 20% DRAM) and 8% logic and other. On the call, management said NAND revenue rose about 40% sequentially as customers moved to 256-layer-plus devices, with early investment in 384-layer devices. DRAM revenue was a record in dollars but fell to 20% of systems revenue from 23%, and foundry was driven by leading-edge nodes, advanced packaging and mature-node spending in China.
- Lam's growth argument is that its addressable market is widening. Management said device complexity and 3D scaling have expanded its served addressable market (SAM) by four points of WFE over the past few years, and the July deck pointed to a "Faster trajectory toward high-30s SAM % of WFE." The October deck adds that AI workloads need QLC, TLC and SLC storage tiers, and that "SLC storage tier adoption could become a meaningful driver of NAND wafer capacity, requiring more capacity for the same bit demand."
- In foundry, logic and DRAM, each node transition brings new tool demand. The Akara conductor etch tool has been adopted by multiple chipmakers, and management said it raises output per wafer by up to 50%. Backside power delivery below 2 nanometers moves power wiring to the back of the wafer, which adds deposition, plating and etch steps.
- By region, China was 35% of revenue, Korea 20%, Taiwan 18%, Japan 9%, the U.S. 8%, Southeast Asia 6% and Europe 4%. In dollars, the 10-Q shows China at $2.89 billion, +26.4% year over year, Korea at $1.63 billion, +110.5%, and Taiwan at $1.48 billion, +44.3%.
- Own calculation (outside China): Excluding China, September-quarter revenue rose from $3.04 billion to $5.33 billion, +75.4%, or 2.9 times China's 26.4% growth. Most of the past year's growth came from outside China.
- CSBG grows with the installed base. Lam expects CSBG revenue to grow more than 30% in 2026, and the deck adds "Expect >15% revenue growth in CY27 YoY." It credits Equipment Intelligence and Dextro cobots with winning performance-based service contracts at several memory makers. The Aether dry resist for EUV patterning is "Ramping in HBM high-volume manufacturing," and Lam now expects about $2.5 billion of cumulative Aether revenue by the end of the decade, about $1 billion more than before. Panel plating systems have shipped to more than 20 customers.
How Lam Compares With Three Equipment Peers
- The peers are three other front-end equipment makers: Applied Materials, with the broadest tool range including deposition and etch; KLA, in inspection and metrology; and ASML, in lithography.
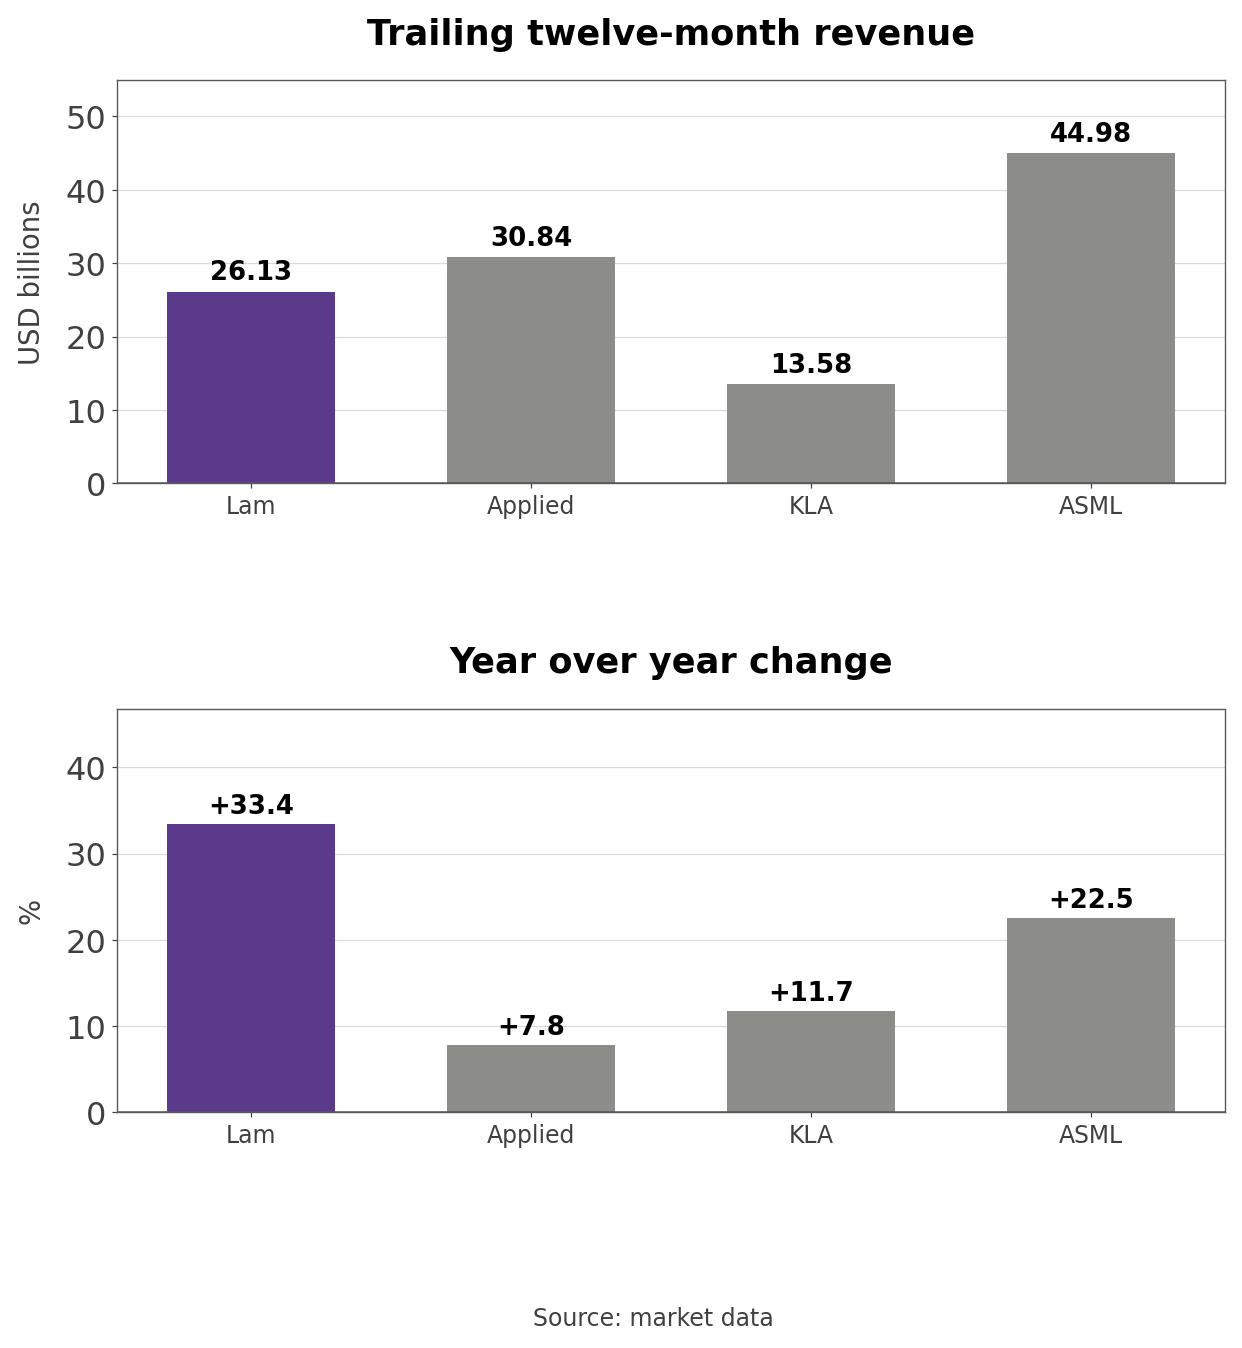
- Lam's TTM revenue of $26.13 billion is below Applied's $30.84 billion and ASML's $44.98 billion and above KLA's $13.58 billion. Its growth of +33.4% is the fastest of the four, ahead of ASML at +22.5%, KLA at +11.7% and Applied at +7.8%. The company with the most memory exposure has grown fastest in this cycle.
- Multiples run the other way. Lam's EV/EBITDA of 28.05 is the lowest of the four, against 29.29 for Applied, 31.59 for KLA and 32.17 for ASML. On forward P/E from market data, Lam is at 22.39, Applied 21.39, KLA 26.65 and ASML 24.74.
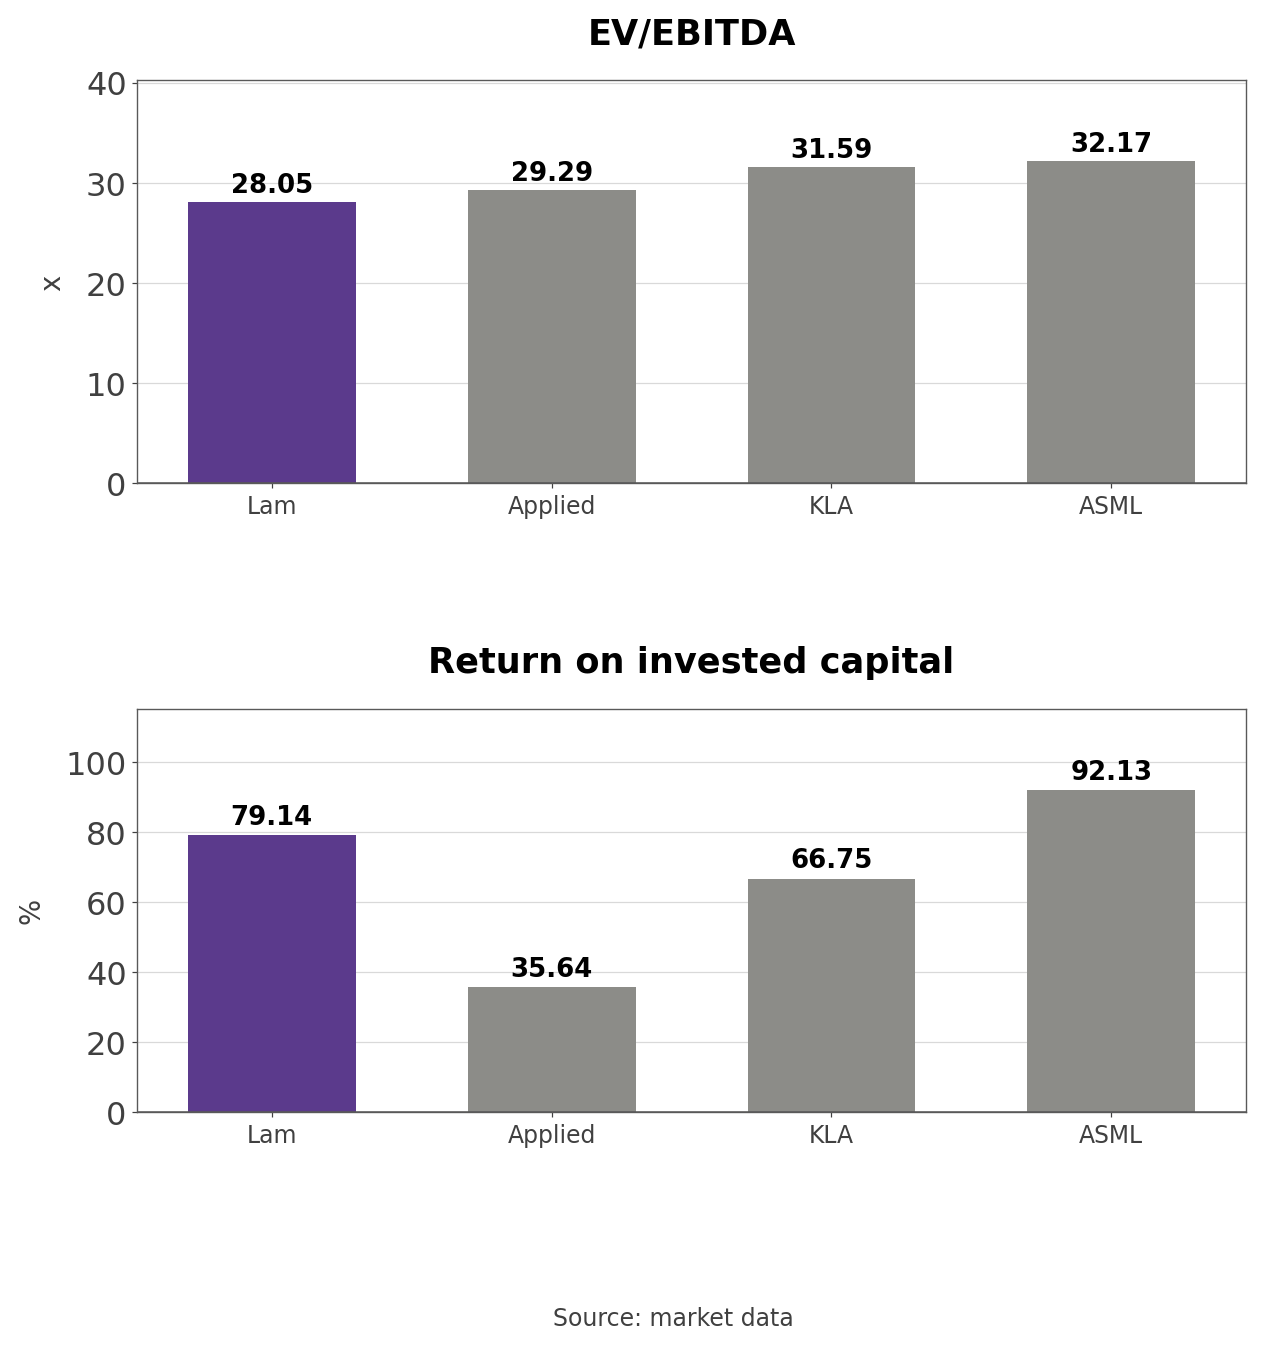
- Lam's return on invested capital (ROIC) of 79.14% trails only ASML's 92.13%, ahead of KLA at 66.75% and Applied at 35.64%. Its free cash flow yield of 2.27% is also second to ASML's 3.92%, above KLA's 1.98% and Applied's 1.88%. In the September quarter Lam returned $1.34 billion, $1.01 billion in buybacks and $325 million in dividends, or 41.2% of free cash flow. It aims to return 85% of free cash flow over the long term, has $3.0 billion left on its buyback authorization and raised the quarterly dividend from $0.26 to $0.33, +26.9%. It ended September with $7.45 billion of cash after repaying $750 million of maturing debt.
P/E and Price-to-Sales Over 83 Months
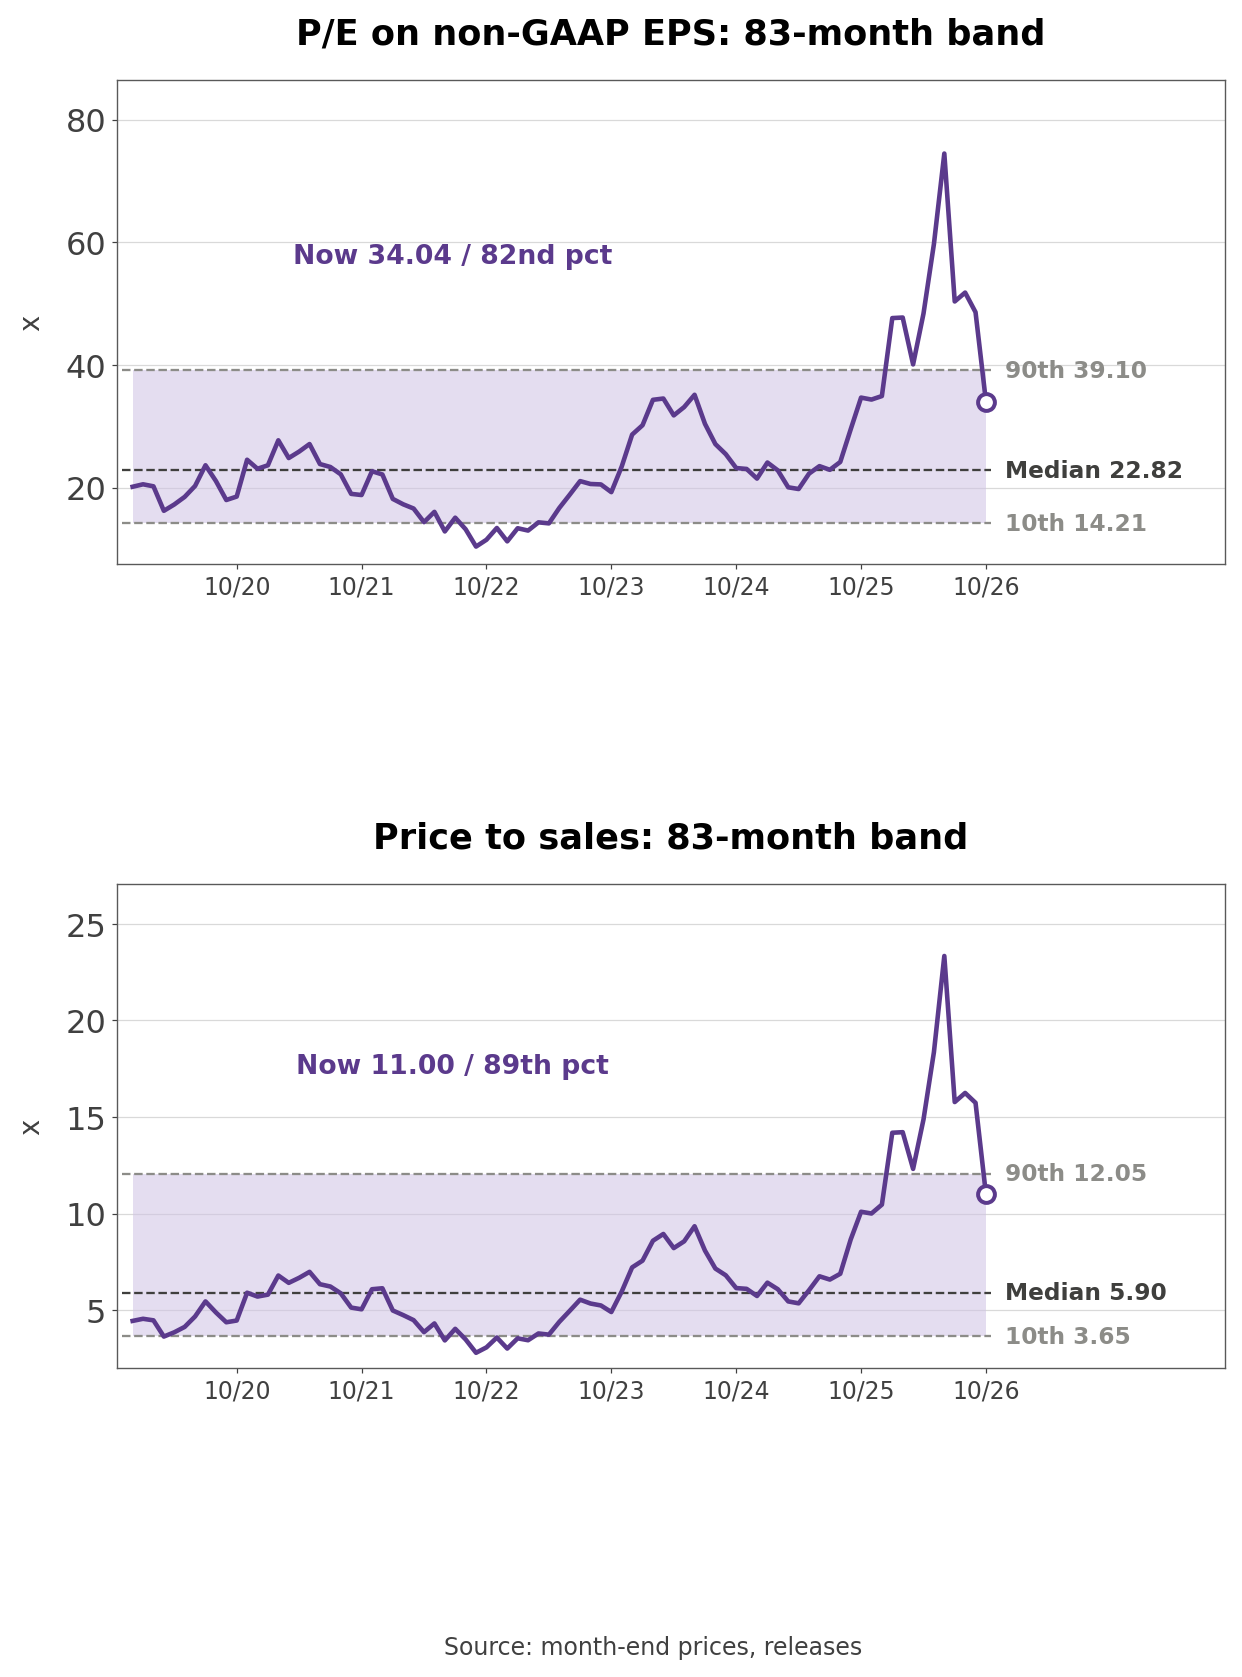
- The P/E on TTM non-GAAP EPS is 34.04, in the 82nd percentile of 83 months since December 2019. The median is 22.82, the 90th percentile 39.10, the low 10.40 in September 2022 and the high 74.46 in June 2026. Price-to-sales of 11.00 is in the 89th percentile, about 1.9 times the 5.90 median.
- June's 74.46 marked a point where the stock ran ahead of earnings. Over the next four months TTM EPS rose and the shares fell, more than halving the multiple, yet it still sits in the top fifth of the distribution. The 23.89 multiple on fiscal 2027 estimates is close to the band median, but it depends on those estimates being met.
Three Conditions That Move the Stock
- Quarterly revenue guidance stands at $8.6 billion for December, +4.6%. If the March-quarter guide in January returns to double-digit growth as delayed shipments come back, the slowdown looks temporary, as management says; if it stays in single digits, supply constraints become a ceiling on revenue.
- The 2027 WFE outlook was first put above $200 billion in October. If January keeps or raises that figure and Lam holds about 19% of WFE as revenue, roughly $37.9 billion of 2027 revenue comes into view; if cleanroom and parts constraints pull it down, the pattern of quarterly raises seen in 2026 breaks.
- China's revenue share was 35% in September, and management expects it to be much lower in December. If Korean and Taiwanese memory spending lifts revenue toward the top of the guidance range, growth continues on a new customer map; if other regions cannot fill the gap, December revenue drifts toward the $8.2 billion low end.
What to Watch in the January Report
- The next numbers are the detailed 2027 WFE outlook and the March-quarter guide due with January results, along with December-quarter CSBG revenue. Management says customer visibility runs through 2028, but the same remarks say cleanroom space and certain components limit how fast the industry can install tools.
- One question remains open. While 2026 WFE rose from about $110 billion to about $155 billion, Lam's revenue grew 42.9%, slightly faster. If 2027 WFE passes $200 billion but cleanrooms and parts slow tool installation, will Lam's revenue follow the market forecast or its suppliers' capacity?
Related Analysis
- Applied Materials (AMAT) Stock Analysis: Guidance Record: the closest peer and its run of guidance beats, a direct comparison with Lam's 27 beats in 30 quarters.
- ASML Stock Analysis: The Bookings Line That Went Missing: the lithography leader in the same WFE cycle, useful for comparing how each company signals future demand.
- TSMC (TSM) Stock: 60% Margins and Guidance It Keeps Beating: one of Lam's largest customers, whose leading-edge and packaging spending sits behind the foundry share of Lam's systems revenue.
#LamResearch #LRCXStock #SemiconductorEquipment #WaferFabEquipment #AIChips #MemoryChips #USStocks #StockAnalysis #EquityResearch #GlobalStockBrief
'US Stock Analysis' 카테고리의 다른 글
| Chubb (CB) Stock: A Record Reserve Release and a 6.2% Yield (0) | 2026.10.26 |
|---|---|
| United Airlines (UAL) Stock: Fuel Recapture Stalls at 72% (0) | 2026.10.26 |
| Philip Morris (PM) Stock: Cigarette Pricing Carries ZYN (0) | 2026.10.26 |
| Intuitive Surgical (ISRG) Stock: The 3% to 5% Instrument Cut (0) | 2026.10.25 |
| Netflix (NFLX) Stock: A $2.8B Warner Fee and Record Buybacks (0) | 2026.10.25 |


