- MakeMyTrip (NASDAQ: MMYT) grew gross bookings +20.9% in constant currency to $2.72 billion in the September 2026 quarter, but reported revenue in dollars rose only +2.5% to $235.2 million. Two things filled the gap: a rupee roughly 10% weaker than a year earlier and $108.9 million of customer inducements, the discounts and incentives that are netted out of revenue. Inducements grew +22.3% and equaled 46.3% of revenue, the highest share in the 18 quarters since April to June 2022.
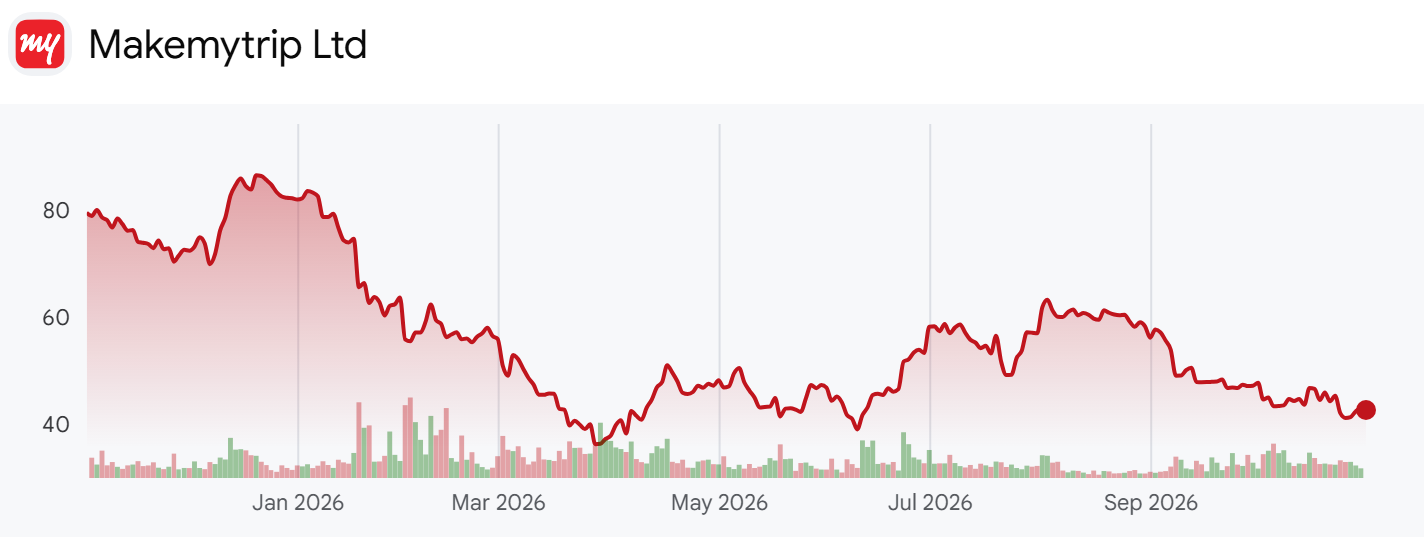
- MakeMyTrip is India's largest online travel company, selling flights, hotels and holiday packages, bus tickets, rail tickets and car rentals through the MakeMyTrip, Goibibo and redBus apps. Its fiscal year ends in March, so this was the second quarter of fiscal 2027. At a $42.68 close the stock is worth about $4.0 billion on market data.
- The questions here are how much of that booking growth survives the discounts, and what the planned India listing of its main subsidiary means for the $1.44 billion of convertible notes that holders can put back in July 2028. The analysis lines up the fiscal Q2 2027 results 6-K, the same release on the IR site, the July 2026 6-K on the MMT India listing, the June 2025 equity and convertible note filings with the indenture, and 18 quarterly results filings since 2022.
- Two caveats apply. Constant currency growth and Adjusted Margin are company-defined non-IFRS measures. The India offering has only been filed confidentially, so its size and price are not public, and the funding math below leaves it out. Air bookings per flight segment is a proxy, because package flights count in segments but not in air gross bookings.
What the Q2 Results Deck Says About Growth and Currency
- The results document on the IR site opens with a summary table that puts IFRS and non-IFRS figures side by side. Gross bookings up 20.9%, Air Adjusted Margin up 14.3%, Hotels and Packages up 20.2%, Bus up 29.0% and Others up 29.8% are all constant currency growth rates. In the same table, reported revenue grew 2.5%, Air revenue fell -7.2% and Hotels and Packages revenue fell -1.0% in dollars.
- Company disclosure (fiscal Q2 2027 results 6-K, October 26, 2026): MakeMyTrip said the rupee depreciated against the dollar by approximately 10% year on year and that "international long-haul outbound travel from India remained subdued, as elevated fuel prices led to higher airfares", while strong domestic demand partly offset that. Group CEO Rajesh Magow said, "We delivered strong growth despite a challenging travel environment."
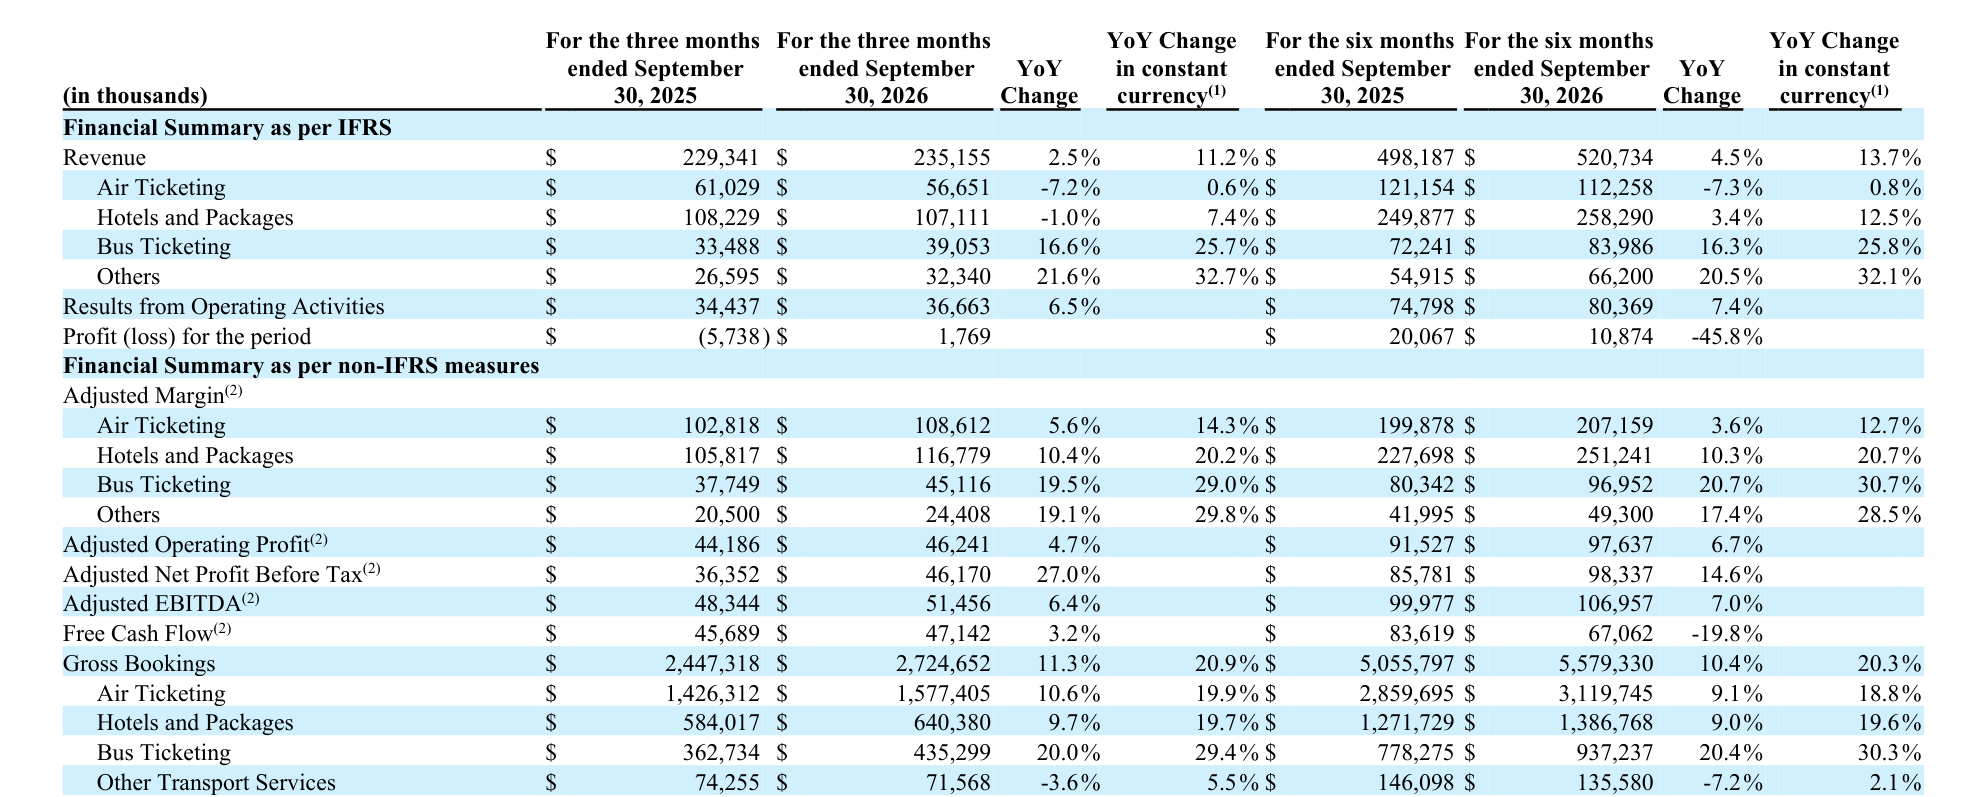
- Page 2 puts numbers on the currency effect. Adding $19.8 million of translation impact to Q2 revenue of $235.2 million gives constant currency revenue of $255.0 million, so 8.7 percentage points separate the 2.5% reported growth from the 11.2% constant currency growth. For the first half the gap was 9.2 points, with reported revenue up 4.5% and constant currency revenue up 13.7%.

- Own calculation (fiscal Q2 2027 results 6-K): Even without currency, revenue and Adjusted Margin moved apart. Constant currency revenue grew 11.2% while constant currency Adjusted Margin grew 19.9%, because revenue nets out the inducements and Adjusted Margin adds them back.
- The profit lines split the same way. Adjusted net profit before tax was $46.2 million, up 27.0%, while IFRS profit was $1.8 million. The reconciliation shows that $29.5 million of the $44.4 million gap is interest on liabilities carried at amortized cost, mainly the convertible notes, with share-based compensation of $6.3 million, acquired-intangible amortization of $3.2 million and tax of $5.1 million making up most of the rest. The company's preferred profit measure leaves the note interest out.
Inducements and Unit Metrics in the Q2 Results Deck
- The page 3 table builds each segment's Adjusted Margin from IFRS revenue plus inducements minus service cost. Air revenue of $56.7 million plus $52.0 million of inducements gives Air Adjusted Margin of $108.6 million, so Air inducements equal 91.7% of Air revenue. Hotels and Packages revenue of $107.1 million plus $50.7 million of inducements minus $41.0 million of service cost gives $116.8 million.
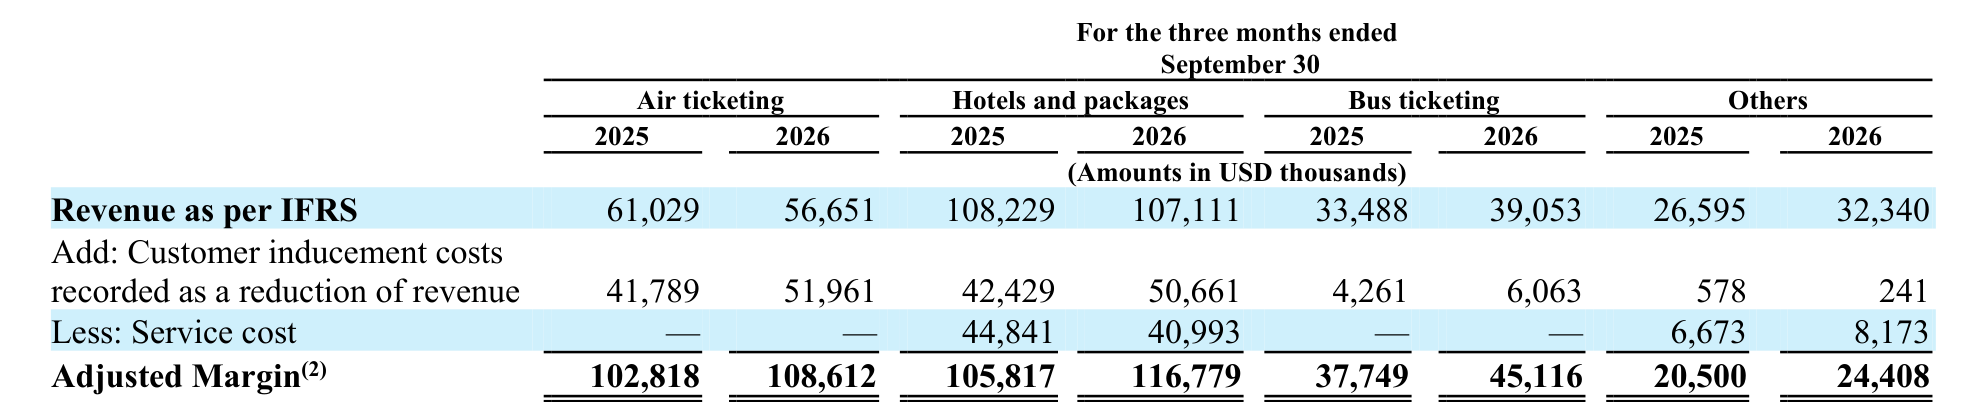
- The company describes inducements as costs "in the nature of customer incentives, customer acquisition costs and loyalty program costs". They are deducted from revenue under IFRS, but management evaluates segments on Adjusted Margin with those costs added back. Marketing and sales promotion expense, booked separately as an operating cost, was $38.9 million, up 2.6%; together with inducements that is 62.9% of revenue.
- The unit metrics on page 15 show volume. Flight segments fell from 14.76 million to 13.93 million, -5.6%, while hotel and package room nights rose 18.5% and bus tickets 24.7%. Air Adjusted Margin as a share of air gross bookings slipped from 7.2% to 6.9%, Hotels and Packages edged up from 18.1% to 18.2%, and Bus held at 10.4%. For the first half the air rate went from 7.0% to 6.6%, a wider gap than in Q2 alone. Hotels and Packages service cost fell from $44.8 million to $41.0 million, which the company put down to rupee translation partly offset by strong car booking demand in India.
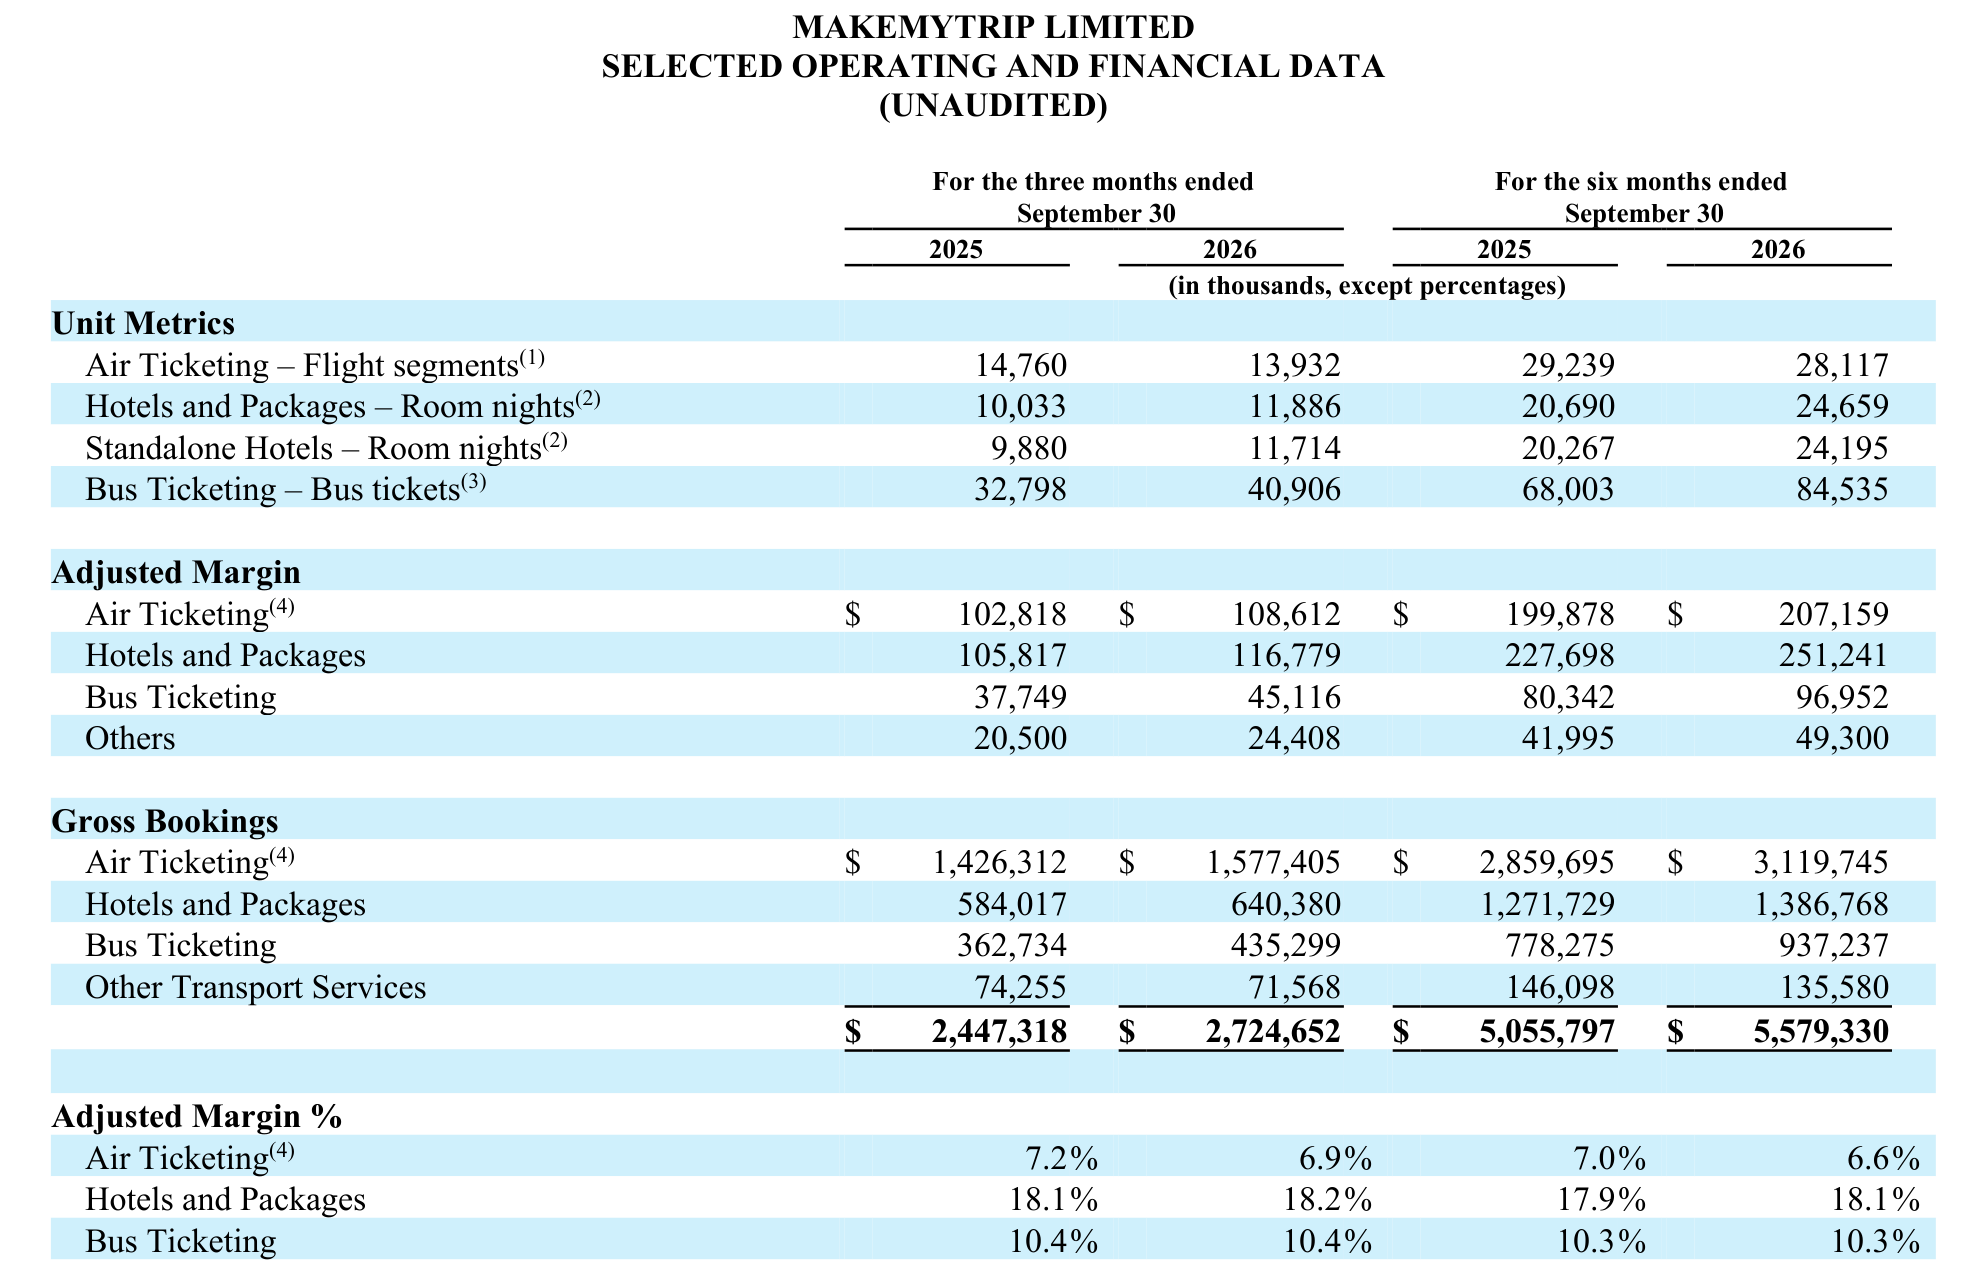
- Air gross bookings still grew 10.6% to $1.58 billion. With fewer segments and more bookings, the increase came from fares, which matches the company's own explanation about fuel prices and airfares. The release credits hotel growth to room nights and bus growth to ticket volumes, but its air commentary does not mention segment counts.
- The press release also leads with the Myra AI trip assistant: more than 90,000 daily conversations, more than 55% from Tier II and Tier III cities, more than 53% of post-booking flight and hotel queries resolved, and users completing about 1.7 times more bookings than non-users. It said Myra assisted more than 3,000 completed bookings a day. At 92 days that is about 276,000 bookings in the quarter, a small slice next to 13.9 million flight segments and 40.9 million bus tickets.
The Bull and Bear Case for MakeMyTrip Shares
- The bull case is volume. Hotel room nights grew 18.5% and bus tickets 24.7%, Adjusted Operating Profit rose 4.7% to $46.2 million and adjusted net profit before tax rose 27.0%. Cash and term deposits total $816.5 million, and an India listing of the main subsidiary would bring in sale proceeds.
- The bear case is discounts and air. Adjusted Margin rose $28.0 million while inducements rose $19.9 million, and flight segments have fallen for three quarters in a row. In July 2028 holders of $1.44 billion of convertible notes can demand cash, the stock trades at 35.1% of the $121.50 conversion price, and price to sales of 3.88 sits in the bottom 3.6% of the past 56 months.
From the Trip.com Buyback to an India Listing
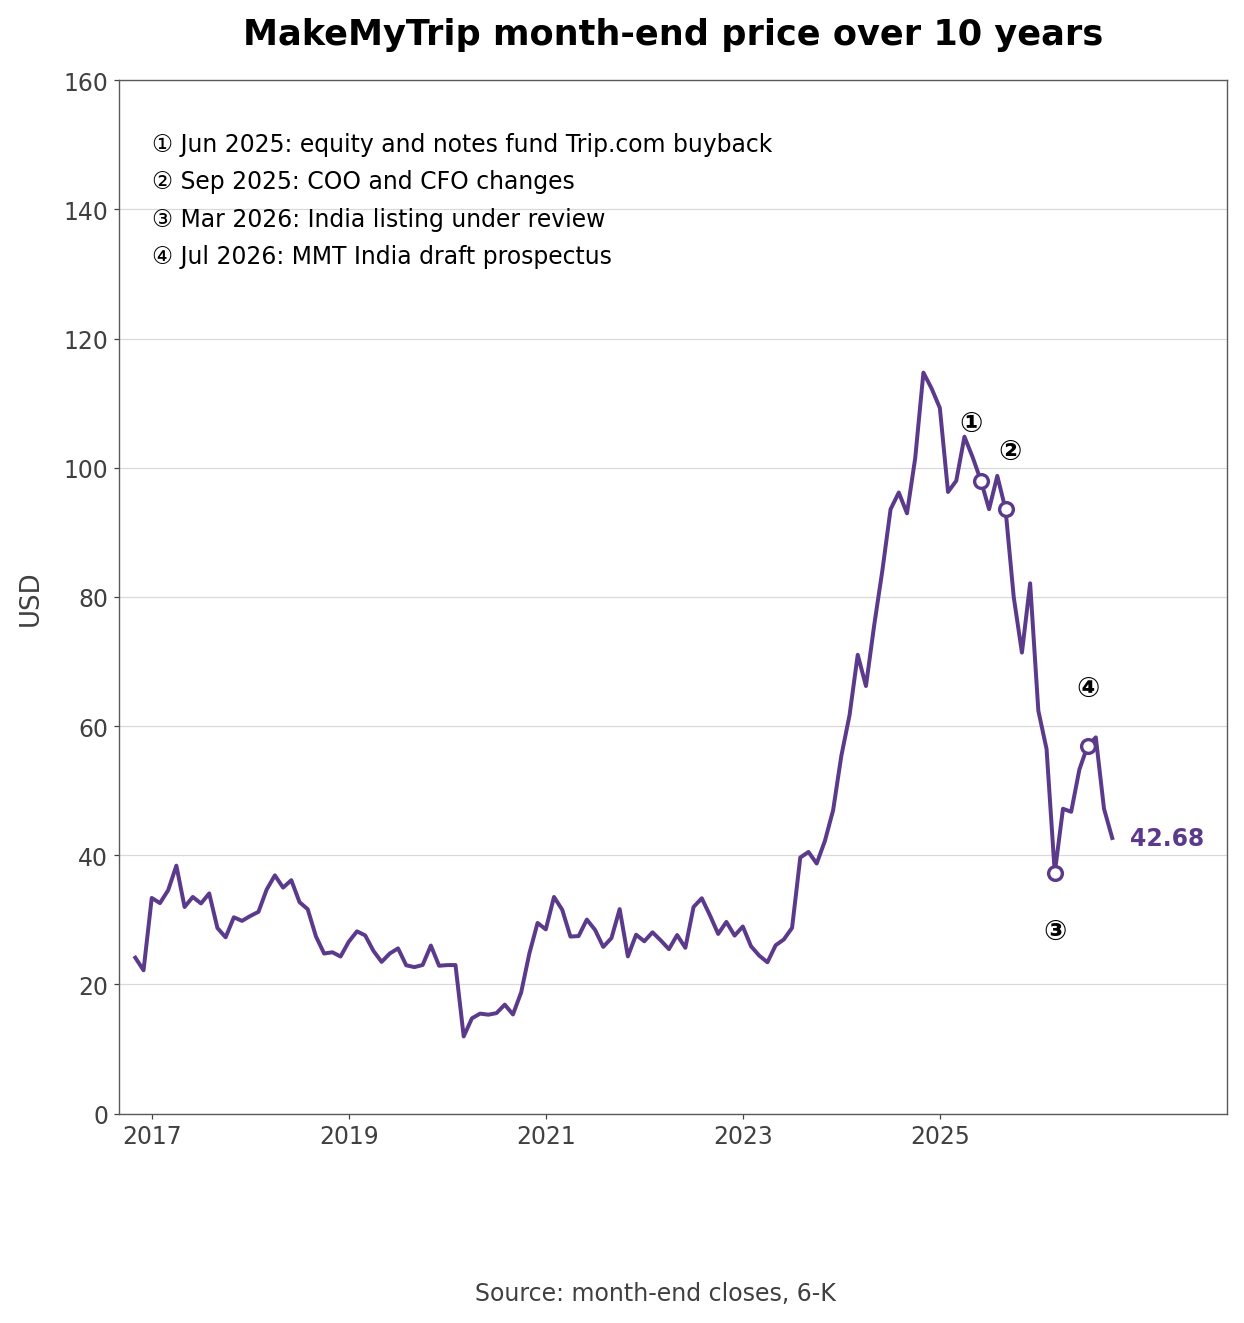
- The stock's highest month-end close in a decade was $114.74 in November 2024. In June 2025 MakeMyTrip sold ordinary shares at $90 for net proceeds of about $1.62 billion and issued $1.44 billion of 0% convertible notes due 2030, using both to repurchase Class B shares from Trip.com. The repurchase agreement put Trip.com's voting power at about 45.30% and aimed to cut its threshold ownership to 19.99% or lower.
- Basic weighted average shares fell from 115.1 million to 98.0 million in the following quarter. From the July to September 2025 quarter on, amortized interest on the notes added $27.5 million to $29.5 million a quarter to finance costs, and IFRS profit for that quarter was a loss of $5.7 million. In September 2025 long-time CFO Mohit Kabra became Group COO and former Wipro executive Dipak Bohra became CFO.
- In March 2026 the company bought a majority stake in regional group-tour operator Flamingo Transworld and said it had merged redBus India into MakeMyTrip (India) and was evaluating an India listing of that entity. The March month-end close of $37.29 was -54.6% below the $82.12 at the end of 2025. On July 17 the subsidiary confidentially filed a pre-filed draft prospectus with India's market regulator. The stock recovered to $56.95 by the end of July and closed October at $42.68.
How Much of the Margin Growth Went to Discounts?
- Own calculation (fiscal Q2 2027 results 6-K): Adjusted Margin grew from $266.9 million to $294.9 million, up $28.0 million. Inducements rose $19.9 million over the same period, and service cost on gross-basis sales fell $2.3 million, so IFRS revenue grew just $5.8 million. About 71% of the Adjusted Margin increase went back out as inducements.
- Measured against air, hotel and bus gross bookings, inducements were 4.11% in Q2, against 3.75% a year earlier and 3.15% two years earlier, and the highest in 18 quarters. The same ratio ran between 3.1% and 3.3% from April to June 2023 through January to March 2025, so the company is now giving back about one more dollar per $100 of bookings.
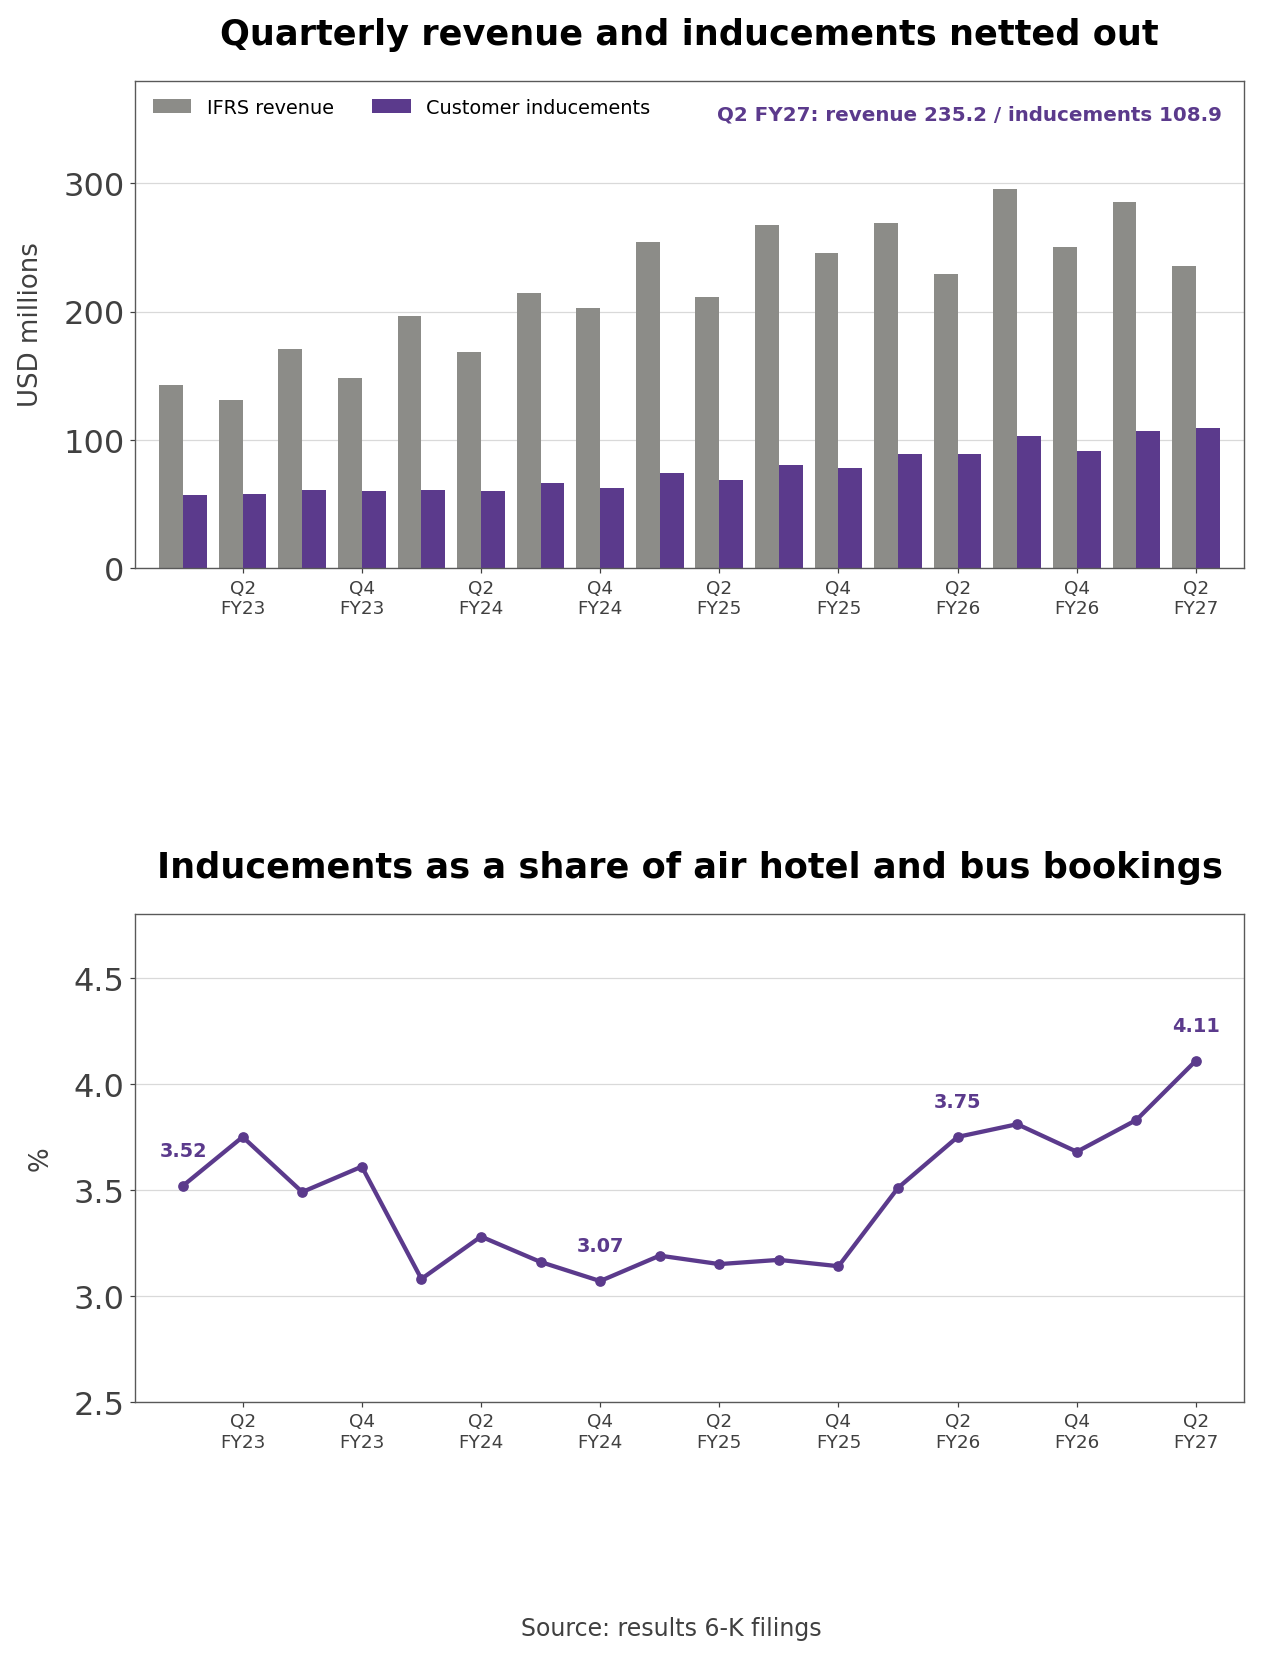
- The increase sits in air and hotels. Air inducements rose from $41.8 million to $52.0 million, +24.3%, and Hotels and Packages inducements from $42.4 million to $50.7 million, up 19.4%, while bus inducements went from $4.3 million to $6.1 million. The company gave no separate reason for the rise; hotel inducements grew at about the same pace as hotel room nights.
Flight Segments and Fares
- Own calculation (18 quarterly results filings): Air gross bookings divided by flight segments came to $113.2 in Q2, up 17.2% from $96.6 a year earlier and the highest in 18 quarters. Segments peaked at 15.36 million in October to December 2025 and have fallen for three straight quarters to 13.93 million.
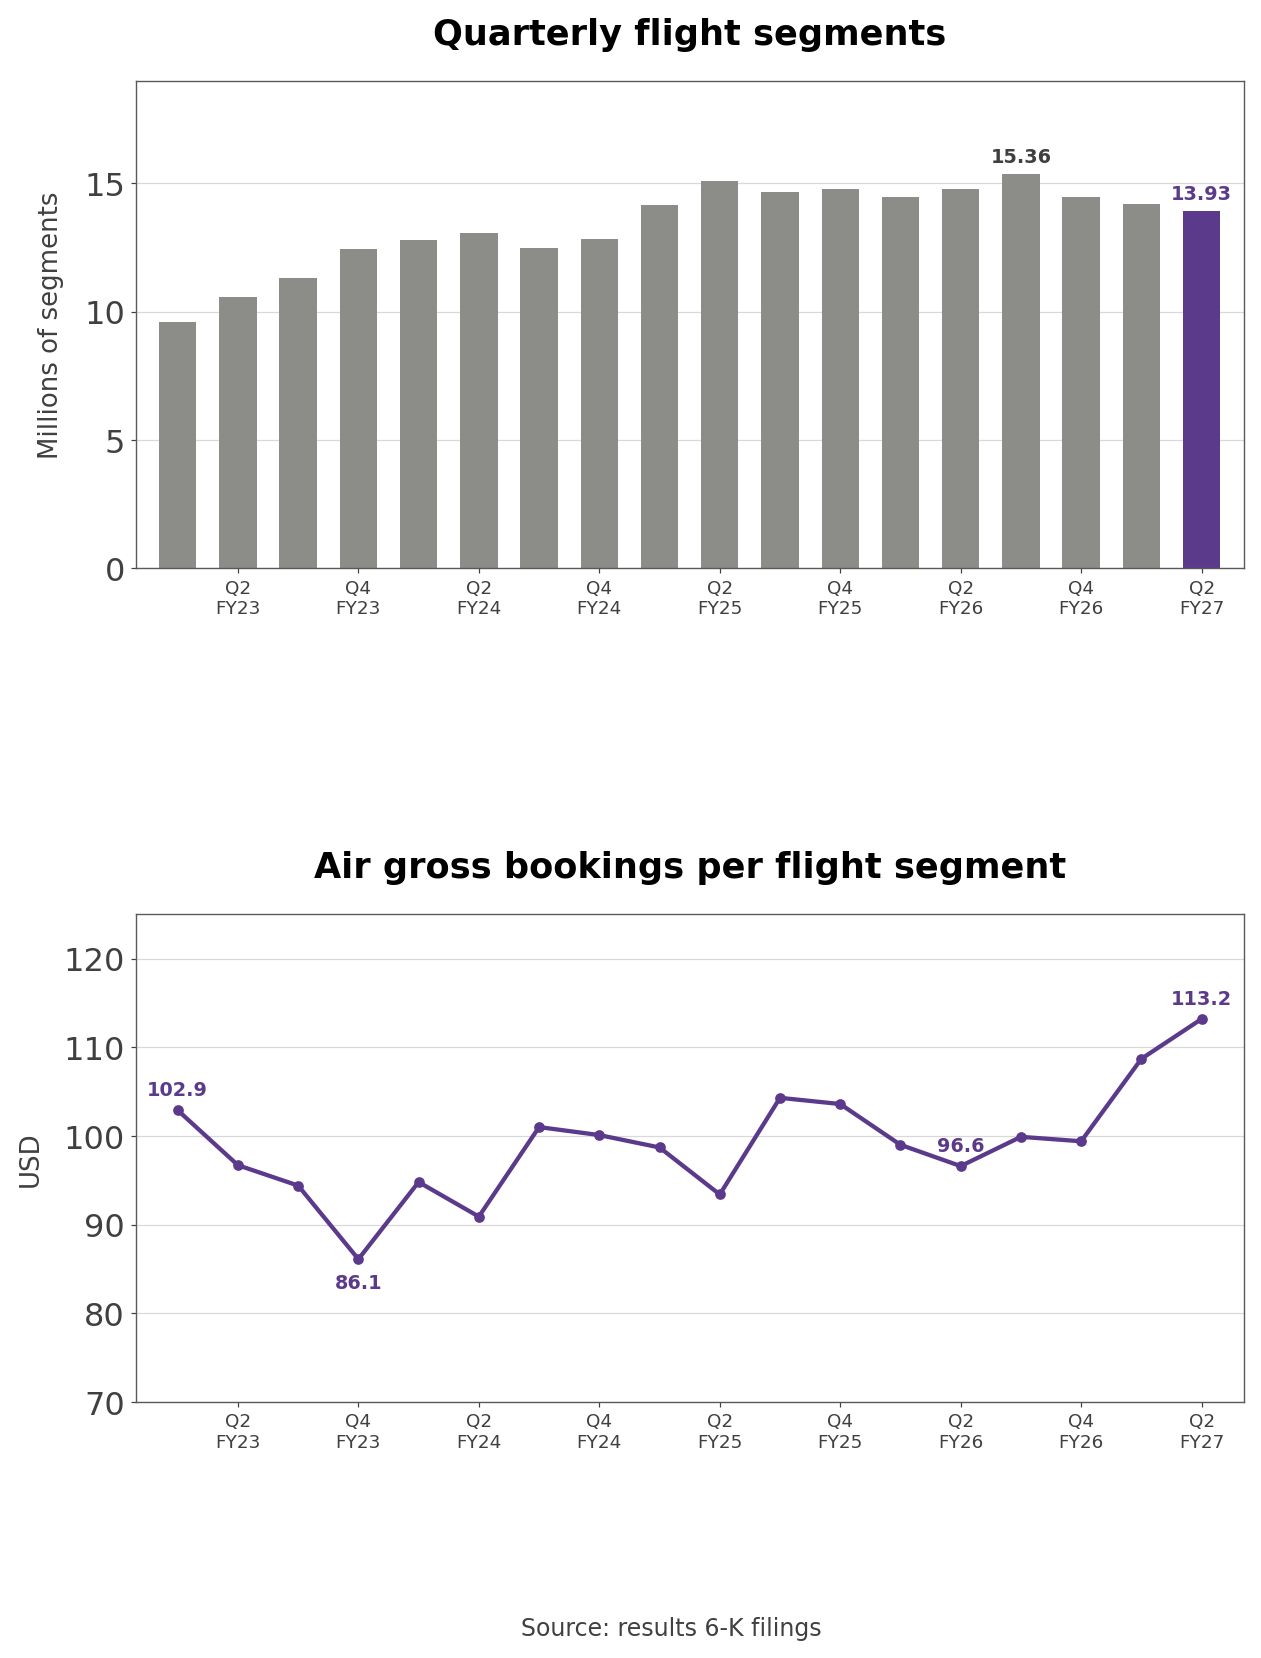
- Higher fares fill the same bookings with fewer passengers. Air Adjusted Margin as a share of bookings went from 7.2% to 6.9%, so margin did not keep up with fare-driven bookings, and air inducements still rose. In its March release MakeMyTrip estimated that "nearly one in three domestic air passengers in India booked their air ticket through our company during fiscal year 2025", which ties its air volume to domestic air traffic.
How MakeMyTrip Makes Money
- MakeMyTrip is an asset-light marketplace. For flights, standalone hotels and bus tickets the supplier is responsible for the service, so revenue is the net amount after paying the supplier; for holiday packages and car bookings through its Savaari subsidiary it acts as principal and books gross revenue. That is why management reports Adjusted Margin by segment.
- On Q2 numbers, per $100 of gross bookings MakeMyTrip kept $10.8 of Adjusted Margin, handed $4.0 back as inducements and added $1.8 of gross-basis service cost, leaving $8.6 of IFRS revenue.
- Q2 revenue splits into Hotels and Packages 45.5%, Air 24.1%, Bus 16.6% and Others 13.8%, while Adjusted Margin splits into Hotels and Packages 39.6%, Air 36.8%, Bus 15.3% and Others 8.3%. Air is 57.9% of gross bookings but only 36.8% of Adjusted Margin, because the Hotels and Packages margin rate of 18.2% is 2.6 times Air's 6.9%. Bus bookings work out to about $10.6 a ticket, or roughly $1.1 of Adjusted Margin per ticket at 10.4%.
- Others covers car bookings and ancillary services such as foreign exchange, prepaid forex cards, cross-border remittances, visa processing, travel insurance and travel credit. Others revenue was $32.3 million, up 21.6%. Outside India the company sells flights and hotels in the United Arab Emirates, and redBus operates in parts of Southeast Asia and Latin America.
- The company says it started in 2000 serving Indians living in the United States and entered India with its India website in September 2005. It later bought Goibibo and redBus, and has added Quest2Travel in corporate travel, Simplotel in hotel technology, BookMyForex, Savaari and Happay. As of December 2025 it reported more than 87 million lifetime transacting retail customers, more than 77,000 SME and corporate customers and more than 549 million app downloads.
- Costs after inducements are mostly people and operations. Personnel expense fell 4.9% to $38.4 million on rupee translation and lower share-based compensation, while other operating expenses such as payment gateway and hosting charges rose 9.3% to $63.7 million. Adjusted Operating Profit of $46.2 million was 15.7% of Adjusted Margin.
The 2028 Put and the MMT India Listing
- Company disclosure (2030 notes indenture, June 23, 2025): The notes total $1.4375 billion and carry no interest. Holders may require MakeMyTrip to repurchase them for cash at 100% of principal on July 3, 2028, and the notes mature on July 1, 2030. The pricing release set the initial conversion price at about $121.50, a 35% premium to the $90 offering price.
- Cash of $427.9 million and term deposits of $388.6 million total $816.5 million, $621.0 million short of the put amount. First-half free cash flow (FCF, operating cash flow minus capital spending) was $67.1 million, down 19.8%, and the company bought back 345,158 shares for $17.2 million in Q2 under a $200 million program for shares and both note series. Equity attributable to shareholders is negative $91.0 million.
- Own calculation (fiscal Q2 2027 results 6-K): If first-half FCF continues for the eight quarters to June 2028, it adds about $268.2 million, still about $352.8 million short of the principal. That assumes the stock stays below the conversion price and most holders put the notes; continued buybacks would widen the gap.
- The July 6-K ties the India listing to this. The offering is expected to be a sale of MMT India shares by MakeMyTrip and its Singapore subsidiary ibibo Holdings, MMT India will remain a consolidated subsidiary, and the proceeds are expected to fund growth, acquisitions and "repurchases of different classes of securities (including convertible securities)".
How MakeMyTrip Compares With Booking Expedia and Trip.com
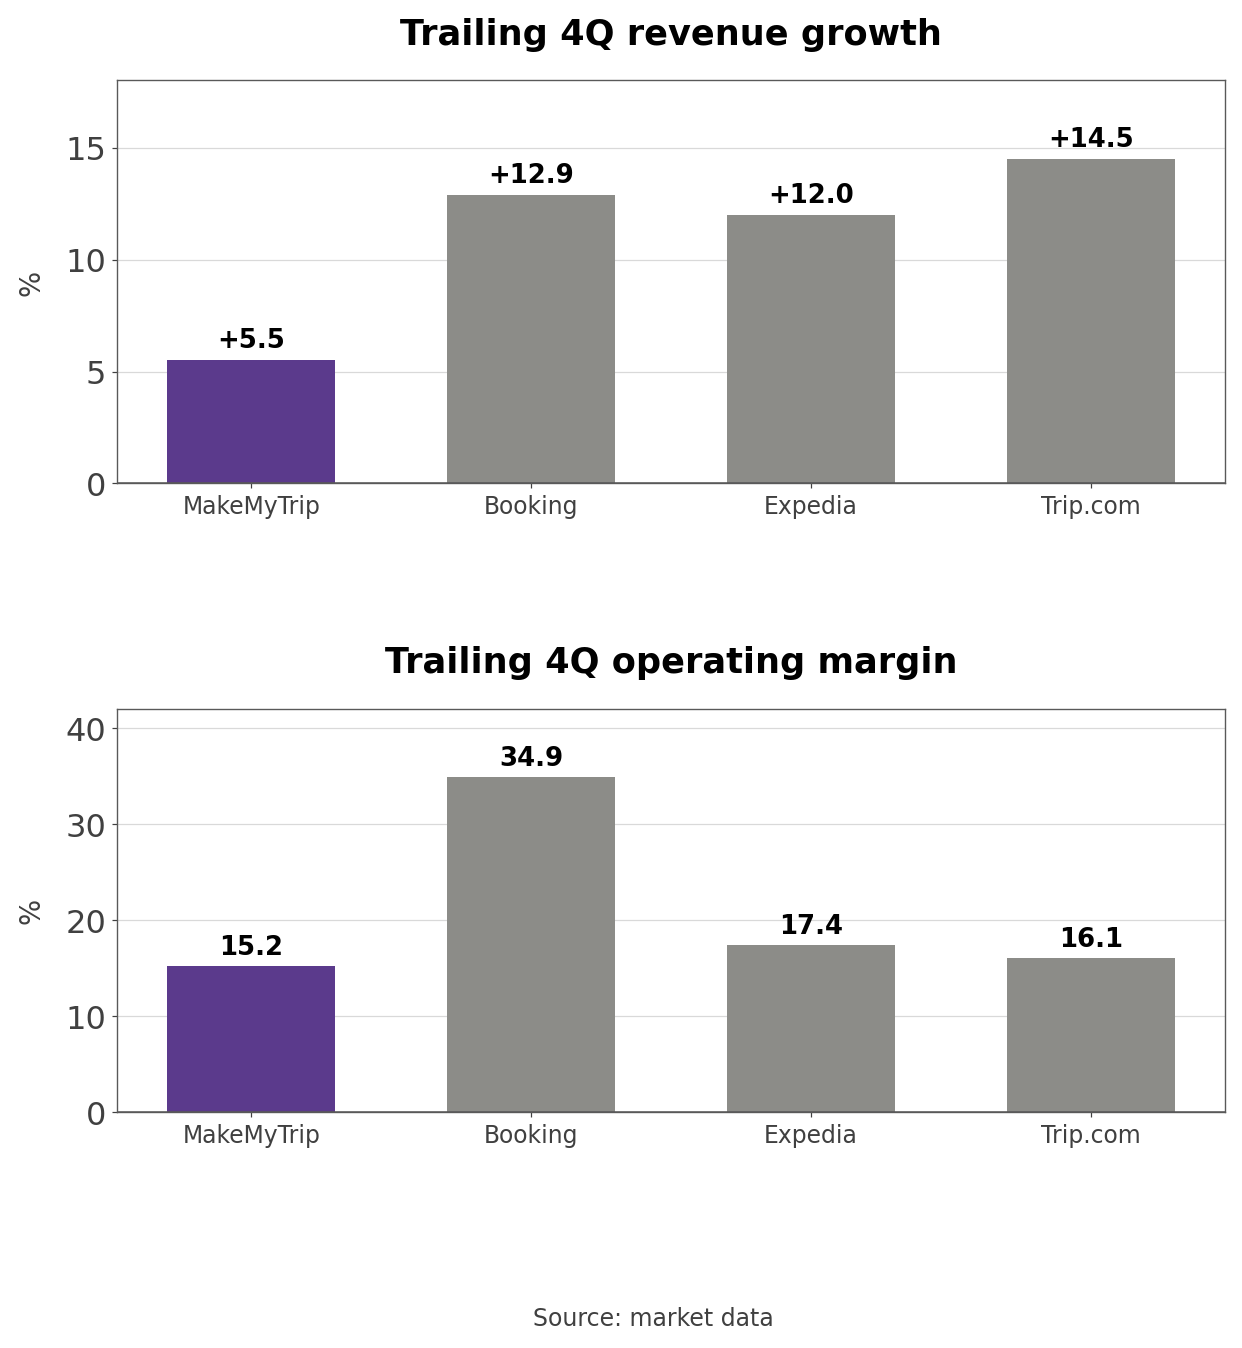
- The peers are Booking and Expedia, the two largest global online travel agents, and Trip.com, which held about 45% of MakeMyTrip's voting power before the June 2025 buyback. On market data, trailing four-quarter revenue growth was 14.5% at Trip.com, 12.9% at Booking, 12.0% at Expedia and 5.5% at MakeMyTrip, and operating margin was 34.9% at Booking, 17.4% at Expedia, 16.1% at Trip.com and 15.2% at MakeMyTrip. MakeMyTrip's figures run to September; the others run to June.
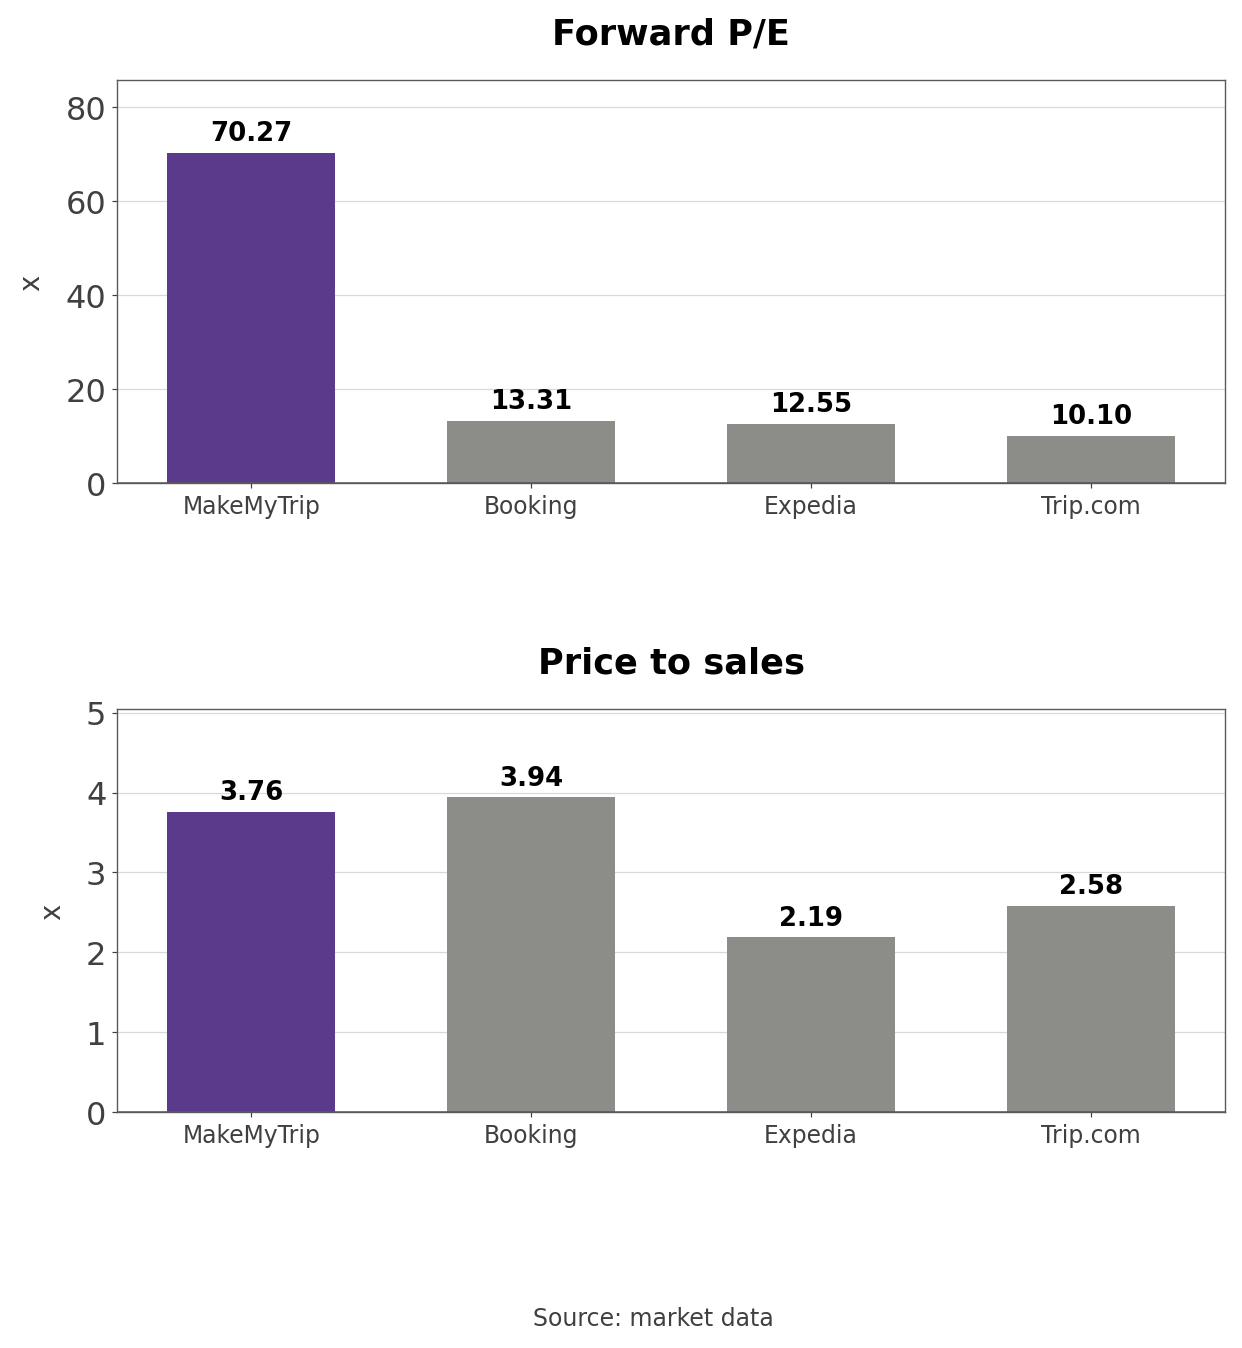
- Forward P/E is 70.27 at MakeMyTrip against 13.31 at Booking, 12.55 at Expedia and 10.10 at Trip.com, inflated by the note interest in IFRS earnings. On price to sales MakeMyTrip is at 3.76, behind Booking's 3.94 and ahead of Trip.com's 2.58 and Expedia's 2.19. Over the past year market value fell -47.9% at Trip.com and -47.0% at MakeMyTrip, against -32.0% at Booking and +26.2% at Expedia.
MakeMyTrip's Price-to-Sales and Price-to-Margin Band
- Equity is negative, so price to book does not work, and note interest absorbs most of IFRS profit, so the band uses price to IFRS sales and price to Adjusted Margin instead.
- Dividing market value by trailing revenue of $1.07 billion gives price to sales of 3.88, about half the 7.44 median of the 56 months since March 2022 and in the 3.6th percentile. The low was 3.47 in March 2026 and the high 14.58 in November 2024. On trailing Adjusted Margin of $1.20 billion the multiple is 3.45, against a 6.96 median. The 3.76 on market data differs because of the share count used.
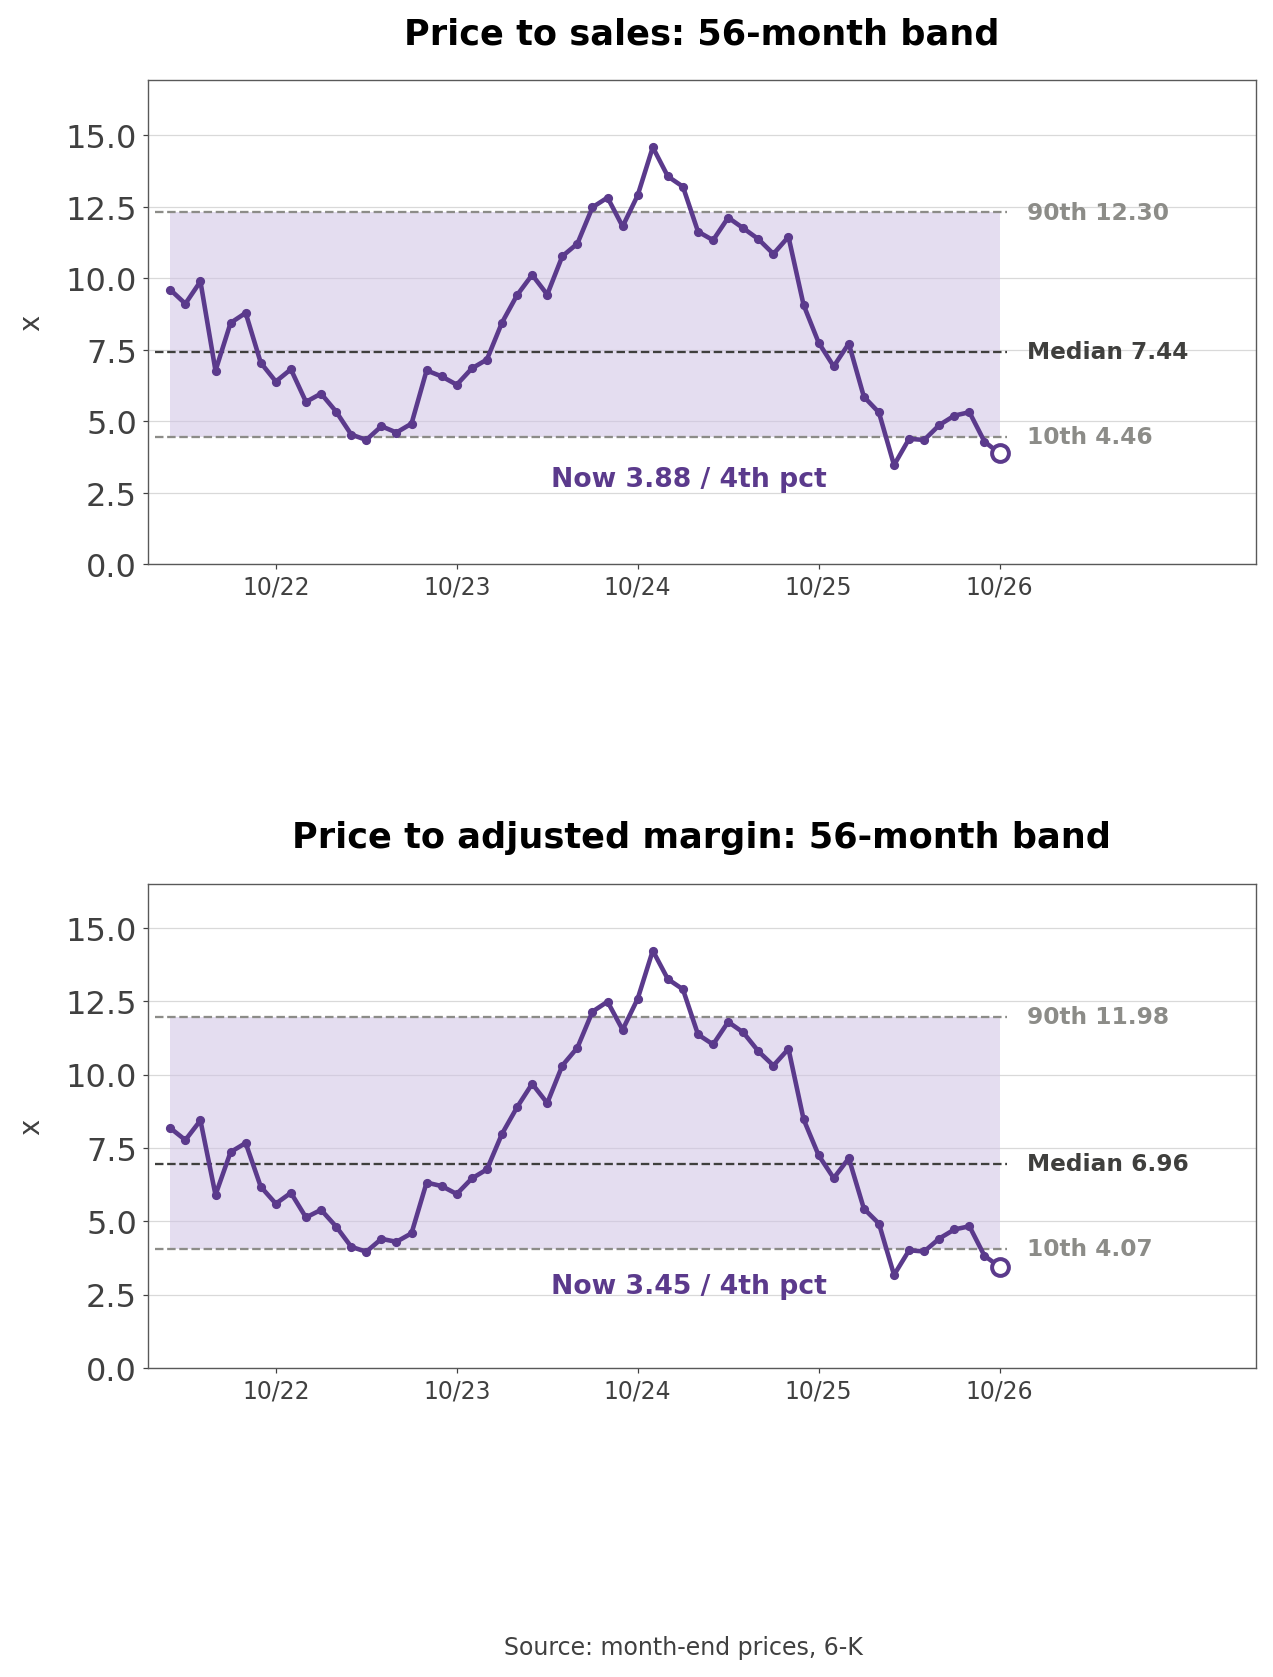
- The two multiples have drifted apart. In November 2024 price to sales was 1.025 times price to Adjusted Margin; in October 2026 it was 1.125 times, the gap that growing inducements opened between margin and revenue.
Three Conditions That Move the Stock
- Inducements were 4.11% of air, hotel and bus bookings in Q2. A return to the 3% range in the December quarter would narrow the gap between IFRS revenue and Adjusted Margin; staying above 4% means discounts keep taking a large share of bookings.
- Flight segments were 13.93 million in Q2 after three quarterly declines. Rising segments would mean passengers, not fares, are lifting air bookings; further declines with higher bookings per segment would put more pressure on the 6.9% air margin rate.
- The MMT India offering terms matter most for the notes. If MakeMyTrip's share of the sale proceeds exceeds the $621.0 million gap between cash and the 2028 put, it can fund note repurchases; if the listing slips, the company will need refinancing or other funding before July 2028.
What to Watch in the December Quarter
- The December quarter results, likely in late January, should show the inducement ratio, flight segments and the rupee again. The inducement ratio is best compared with 3.81% in the same quarter a year earlier to strip out seasonality.
- One question stays open. The July 6-K says MakeMyTrip may later look at giving shareholders "a security at MMT India level that is fungible and listed across India and US capital markets", and the 2030 notes indenture has a clause that swaps the underlying shares when they are replaced by newly listed equity. If the India listing goes that far, what will noteholders actually receive on conversion?
Related Analysis
- Trip.com (TCOM) Stock Analysis: Antitrust Fine and Guidance: the Chinese online travel agent that held about 45% of MakeMyTrip's votes until June 2025, useful for comparing growth and multiples.
- Uber (UBER) Stock Analysis: Gross Bookings vs Revenue Gap: another platform where reported revenue and gross bookings diverge, a parallel to MakeMyTrip's inducements.
#MakeMyTrip #MMYTStock #TravelStocks #IndiaStocks #OnlineTravel #Convertible #USStocks #StockAnalysis #EquityResearch #GlobalStockBrief
'US Stock Analysis' 카테고리의 다른 글
| GE Vernova (GEV) Stock: Deposits Drive the $16B Cash Guide (0) | 2026.11.05 |
|---|---|
| Boeing (BA) Stock: A $10 Billion Cash Target Built on 777X (0) | 2026.11.04 |
| Chevron (CVX) Stock: Refining Carried Q3 as Brent Fell (0) | 2026.11.03 |
| AstraZeneca (AZN) Stock: Oncology Fills the Farxiga Gap (0) | 2026.11.03 |
| Intel (INTC) Stock: A 6.1% Q4 Cut as Servers Pass PCs (0) | 2026.11.02 |


