- At any given time, the market has a finite pool of risk capital. If you can identify where that capital is flowing—and where it is leaving—you have already solved a large part of the positioning problem.
- This article explains how to track those shifts with one tool: relative strength, or RS. Three core concepts and one chart are enough to start reading sector rotation with far greater clarity.
When the thesis is right but the stock goes nowhere
- You did the work. You reviewed the financials, mapped the industry, and selected a company you genuinely believe in—yet the stock refuses to move. Nearly every investor has been in that position. Often, the company is not the problem. The bid simply has not reached its sector.
- Markets price securities relative to one another, not in isolation. If another sector advances 20% while your stock gains 5%, that 5% return still represents underperformance. Capital tends to migrate toward the assets already demonstrating superior relative performance.
- This is more than market folklore. William O’Neil, author of How to Make Money in Stocks, studied 500 of the biggest winners in the U.S. market across several decades. Immediately before their major advances, those stocks carried an average relative strength rating of 87 out of 100. In other words, many of the market’s largest winners were already leaders before their strongest runs began.
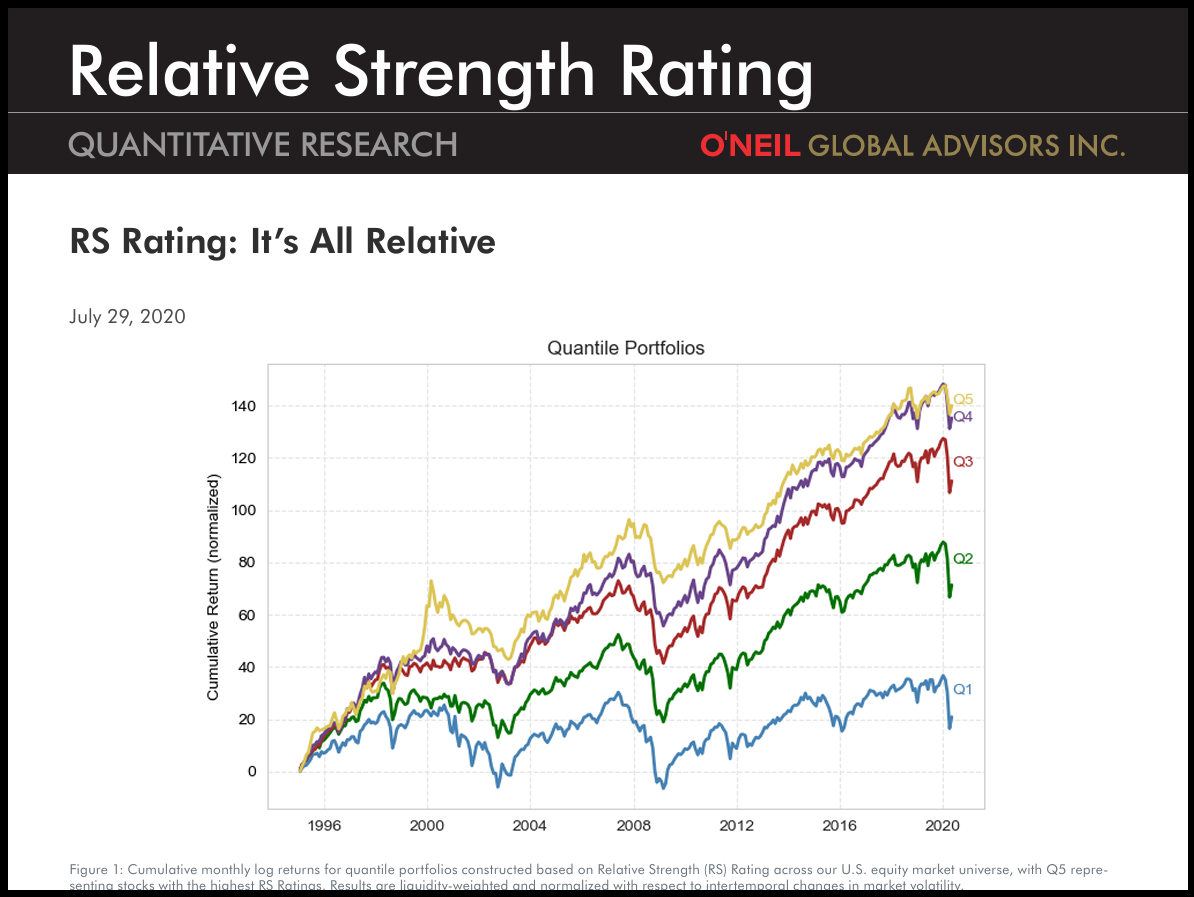
- A landmark 1993 momentum study published in The Journal of Finance reached the same broad conclusion. A strategy that bought recent winners and sold recent losers generated approximately 12% in annual excess returns. The framework was simple, but the result was powerful: strength often persists longer than investors expect.
RS tells you what is happening : not what happens next
- Relative strength is not a forecasting tool, and treating it like one is a mistake. RS measures comparative leadership as it exists now. It tells you where the market’s relative strength is concentrated, not where prices are guaranteed to go next.
- Think of RS less like a weather forecast and more like a market thermometer. It cannot tell you tomorrow’s weather, but it can show you precisely where the heat is concentrated today.
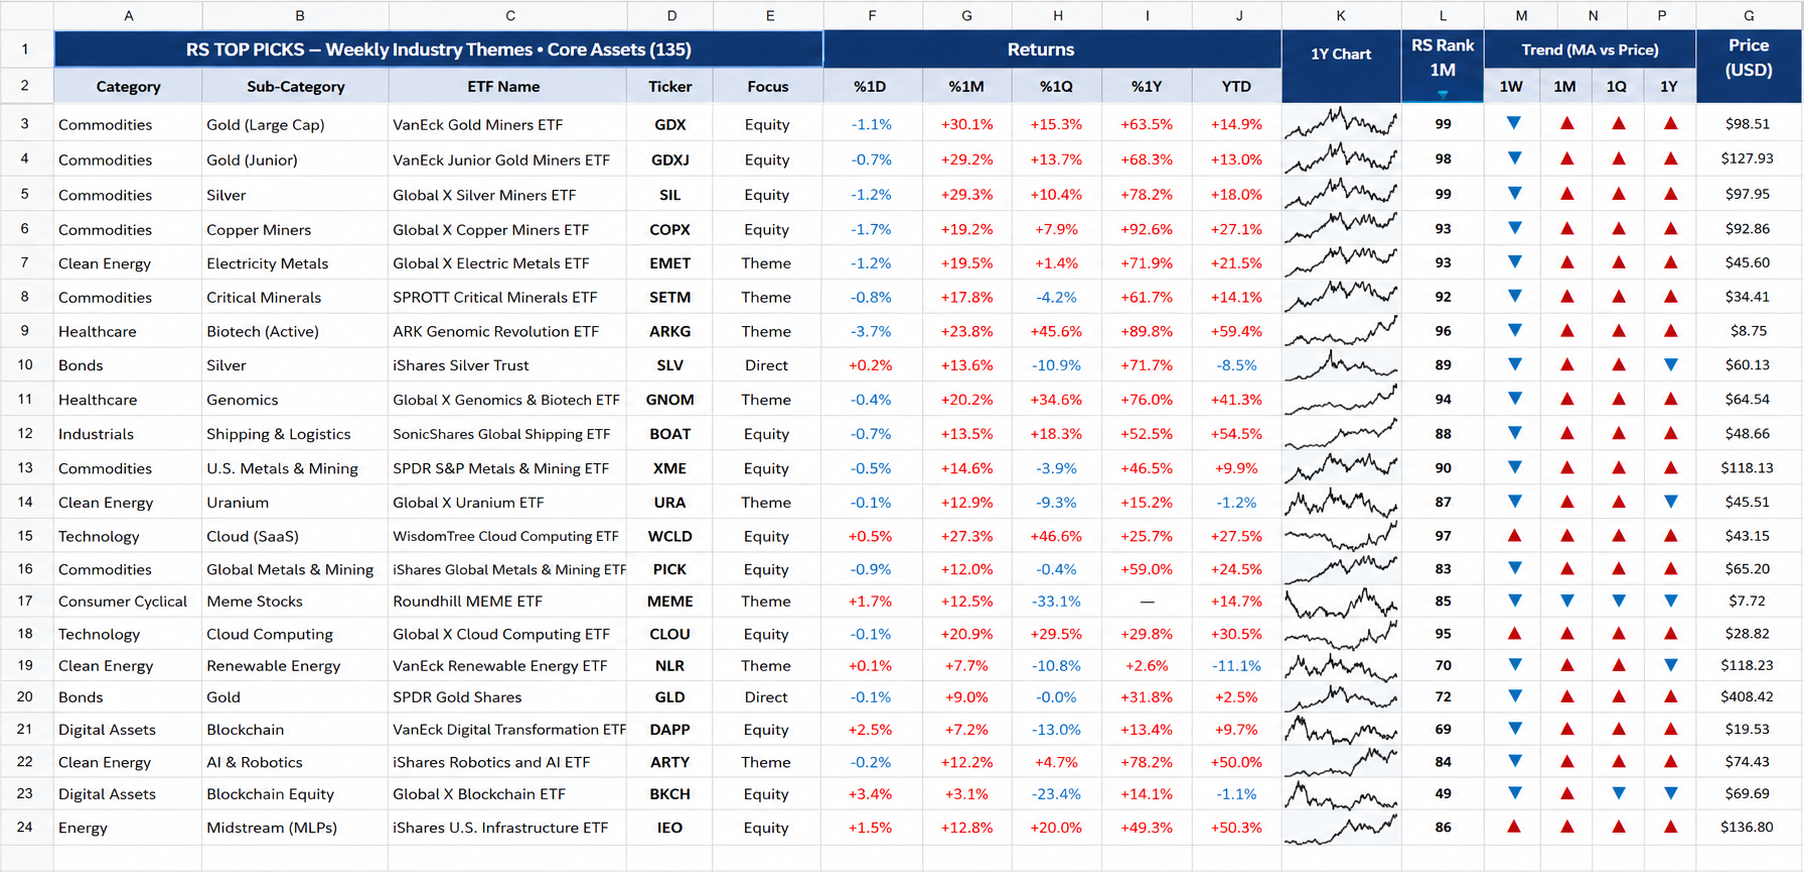
- Each trading day, we rank all 39 Korean sector ETFs and the 405 individual stocks they contain. Comparing one session’s rankings with the next often reveals the direction of sector rotation more clearly than looking at isolated price moves.
Three concepts are enough to get started
One ETF can stand in for an entire sector
- You do not need to know every company in an industry to understand how that industry is trading. A quick look at an ETF such as TIGER Cosmetics provides a useful read on the cosmetics sector as a whole.
- Because a sector ETF packages its leading constituents into a single basket, it offers one of the cleanest ways to monitor the market sector by sector.
RS measures rank, not return
- This is the distinction that causes the most confusion. RS is not a percentage return. It is a percentile ranking within a defined comparison group.
- A reading of 100 represents first place among the 39 names being compared, 50 sits near the middle, and 0 marks the bottom. Think of it as your position in the class, not your raw exam score.
- That is why a stock can rise while its RS declines: the stock went up, but its peers went up more. The absolute return was positive; the relative performance weakened.
| RS range | Relative position | How to interpret it |
| 90 and above | Top 10% | Clear market leadership |
| 70–89 | Upper tier | Participating in the leading flow |
| Around 50 | Middle of the group | Keeping pace with the broader market |
| 30 and below | Lower tier | Capital is rotating elsewhere |
Trend arrows show the condition of the move
- Rank alone does not tell the full story. A stock can stage a short-lived bounce within a larger downtrend and still climb the rankings for a few sessions.
- That is why we pair RS with a trend indicator. A price above its one-month average receives a 🔺; a price below that average receives a 🔽.
| Symbol | Price position | Trend reading |
| 🔺 | Above the average | Uptrend remains intact |
| 🔽 | Below the average | Price remains under pressure |
| ▲▲▲ | Above the short-, medium-, and long-term averages | Full bullish alignment |
- We assign a separate symbol to the short-, medium-, and long-term trend. Three upward readings indicate the cleanest alignment. By contrast, a high RS rank paired with three downward readings may simply reflect a temporary bounce within a broader decline.
RRG: locating a sector within the rotation cycle
- The rankings show relative position. The chart shows trajectory.
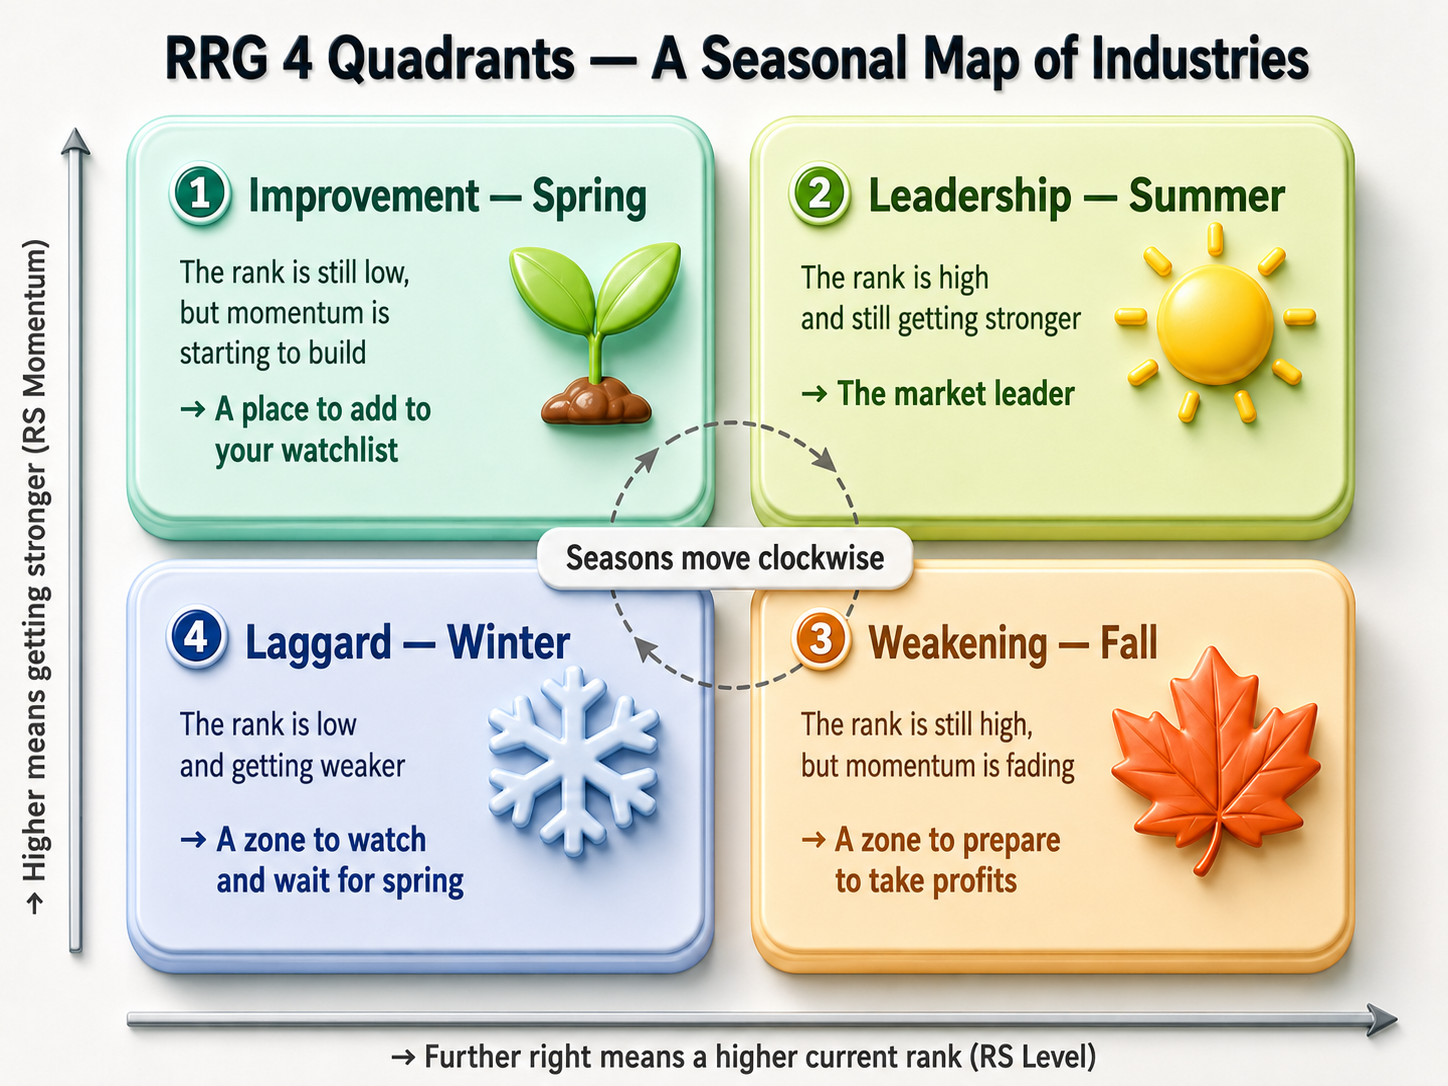
- A Relative Rotation Graph, or RRG, plots relative strength on the horizontal axis and the momentum of that relative strength on the vertical axis. When sectors are plotted as points over time, they typically move through the four quadrants in a clockwise rotation.
- One way to visualize the cycle is as a trip across a hill: the climb, the summit, the descent, and the valley before the next ascent begins.
| Position in the cycle | RRG quadrant | Relative condition | Typical interpretation |
| The climb | ① Improving — spring | Still weak, but gaining momentum | Capital may be starting to rotate in |
| The summit | ② Leading — summer | Strong with positive momentum | Leadership is firmly established |
| The descent | ③ Weakening — autumn | Still strong, but losing momentum | Leadership may be starting to fade |
| The valley | ④ Lagging — winter | Weak with negative momentum | Capital remains focused elsewhere |
- The quadrant matters, but the direction of travel matters more. A sector may still sit in the Leading quadrant while already curling toward Weakening, suggesting that the move is becoming mature. Another sector may remain in Lagging but turn decisively toward Improving, signaling that a new rotation could be developing. The trajectory often carries more information than the label itself.
How I read the report
- If you have only a minute, start with the three-line snapshot at the top: the three strongest stocks today, the sectors gaining relative ground, and the sectors losing it.
- If you want the fuller picture, this is the order I use.
Top five leading sectors: the one-month view
- This table ranks the five strongest sectors over the past month and places each one alongside its daily move and short-, medium-, and long-term trend readings.
- Persistence is what separates genuine leadership from a one-day squeeze. Sectors that remain near the top over time deserve attention. Still, a high RS rank paired with downward readings across every timeframe may be nothing more than a relief bounce.
Top five rising sectors: today’s impulse
- This table ranks sectors by their performance today. If the one-month table shows structural leadership, this one captures the market’s immediate impulse.
- A sector appearing on both lists has established leadership and fresh momentum. A sector appearing only on the daily list, while carrying a weak one-month rank, may be attempting to turn off the bottom—but it still needs follow-through.
Rollover warnings and rebound signals
- The report includes two alerts designed to flag potential inflection points before they are lost in the daily noise.
| Signal | Trigger | What it may indicate |
| 🔻 Rollover warning | Rank falls by 15 or more places within five sessions | A possible shift from Leading toward Weakening |
| 🔺 Rebound signal | Rank climbs by 15 or more places from the bottom tier | A possible turn from Lagging toward Improving |
- These changes in direction often matter more than the static rank. A move from 30th to 15th reveals fresh acceleration. A leader holding first place for several more sessions may still be strong, but the incremental information is smaller.
Three stocks a day: a four-filter screen
- For individual stocks, we layer four conditions to reduce the influence of one-day spikes:
· Top 40% for the current session
· Top 25% over the past week
· Top 15% over the past month
· Full trend alignment across all three timeframes (▲▲▲)
- A stock that clears all four filters has demonstrated persistent relative strength, not merely one strong session. We also show every ETF in which the stock appears. Inclusion across multiple sector or thematic ETFs can help identify names benefiting from more than one active market theme.
Three common misreads
- “RS is 100, so the stock is a buy—right?” No. An RS reading of 100 means the stock ranks first within its comparison group; it is not an automatic entry signal. If every trend indicator points down, the stock may simply be falling less than everything around it. Rank and trend must be read together.
- “The rank fell. Should I sell immediately?” Not necessarily. Rankings fluctuate from one session to the next. A move becomes more meaningful when it develops into a clear directional shift—such as a decline of 15 or more places within five sessions.
- “RS is another way of expressing return, isn’t it?” No. An RS reading of 80 does not mean an 8% gain; it means the stock sits in the top 20% of its comparison group. On a broadly negative day, a high-RS stock can still close lower in absolute terms.
A five-minute routine for every trading day
· Read the three-line summary to establish the tone of the session.
· Locate your sectors on the RRG: note both the quadrant and the direction of travel.
· Identify sectors appearing on both the leading and rising lists.
· Review the rollover and rebound alerts for possible inflection points.
· Treat the three selected stocks as a research starting point, not a finished trade thesis.
- The short version is simple: RS tells you the rank, the trend indicators show the condition of the move, and the rollover and rebound alerts flag potential turns. Where a sector sits matters, but where it is heading matters more than any single day’s ranking.
- ⚠️ This material is for informational purposes only and does not constitute a recommendation to buy or sell any security. Relative strength measures performance within a comparison group and does not guarantee a positive absolute return. All investment decisions—and the responsibility for their outcomes—remain with the investor.
#RelativeStrength #RS #RRG #SectorRotation #ETFInvesting #MomentumInvesting #KoreanStocks #StockMarketBasics


